Overview
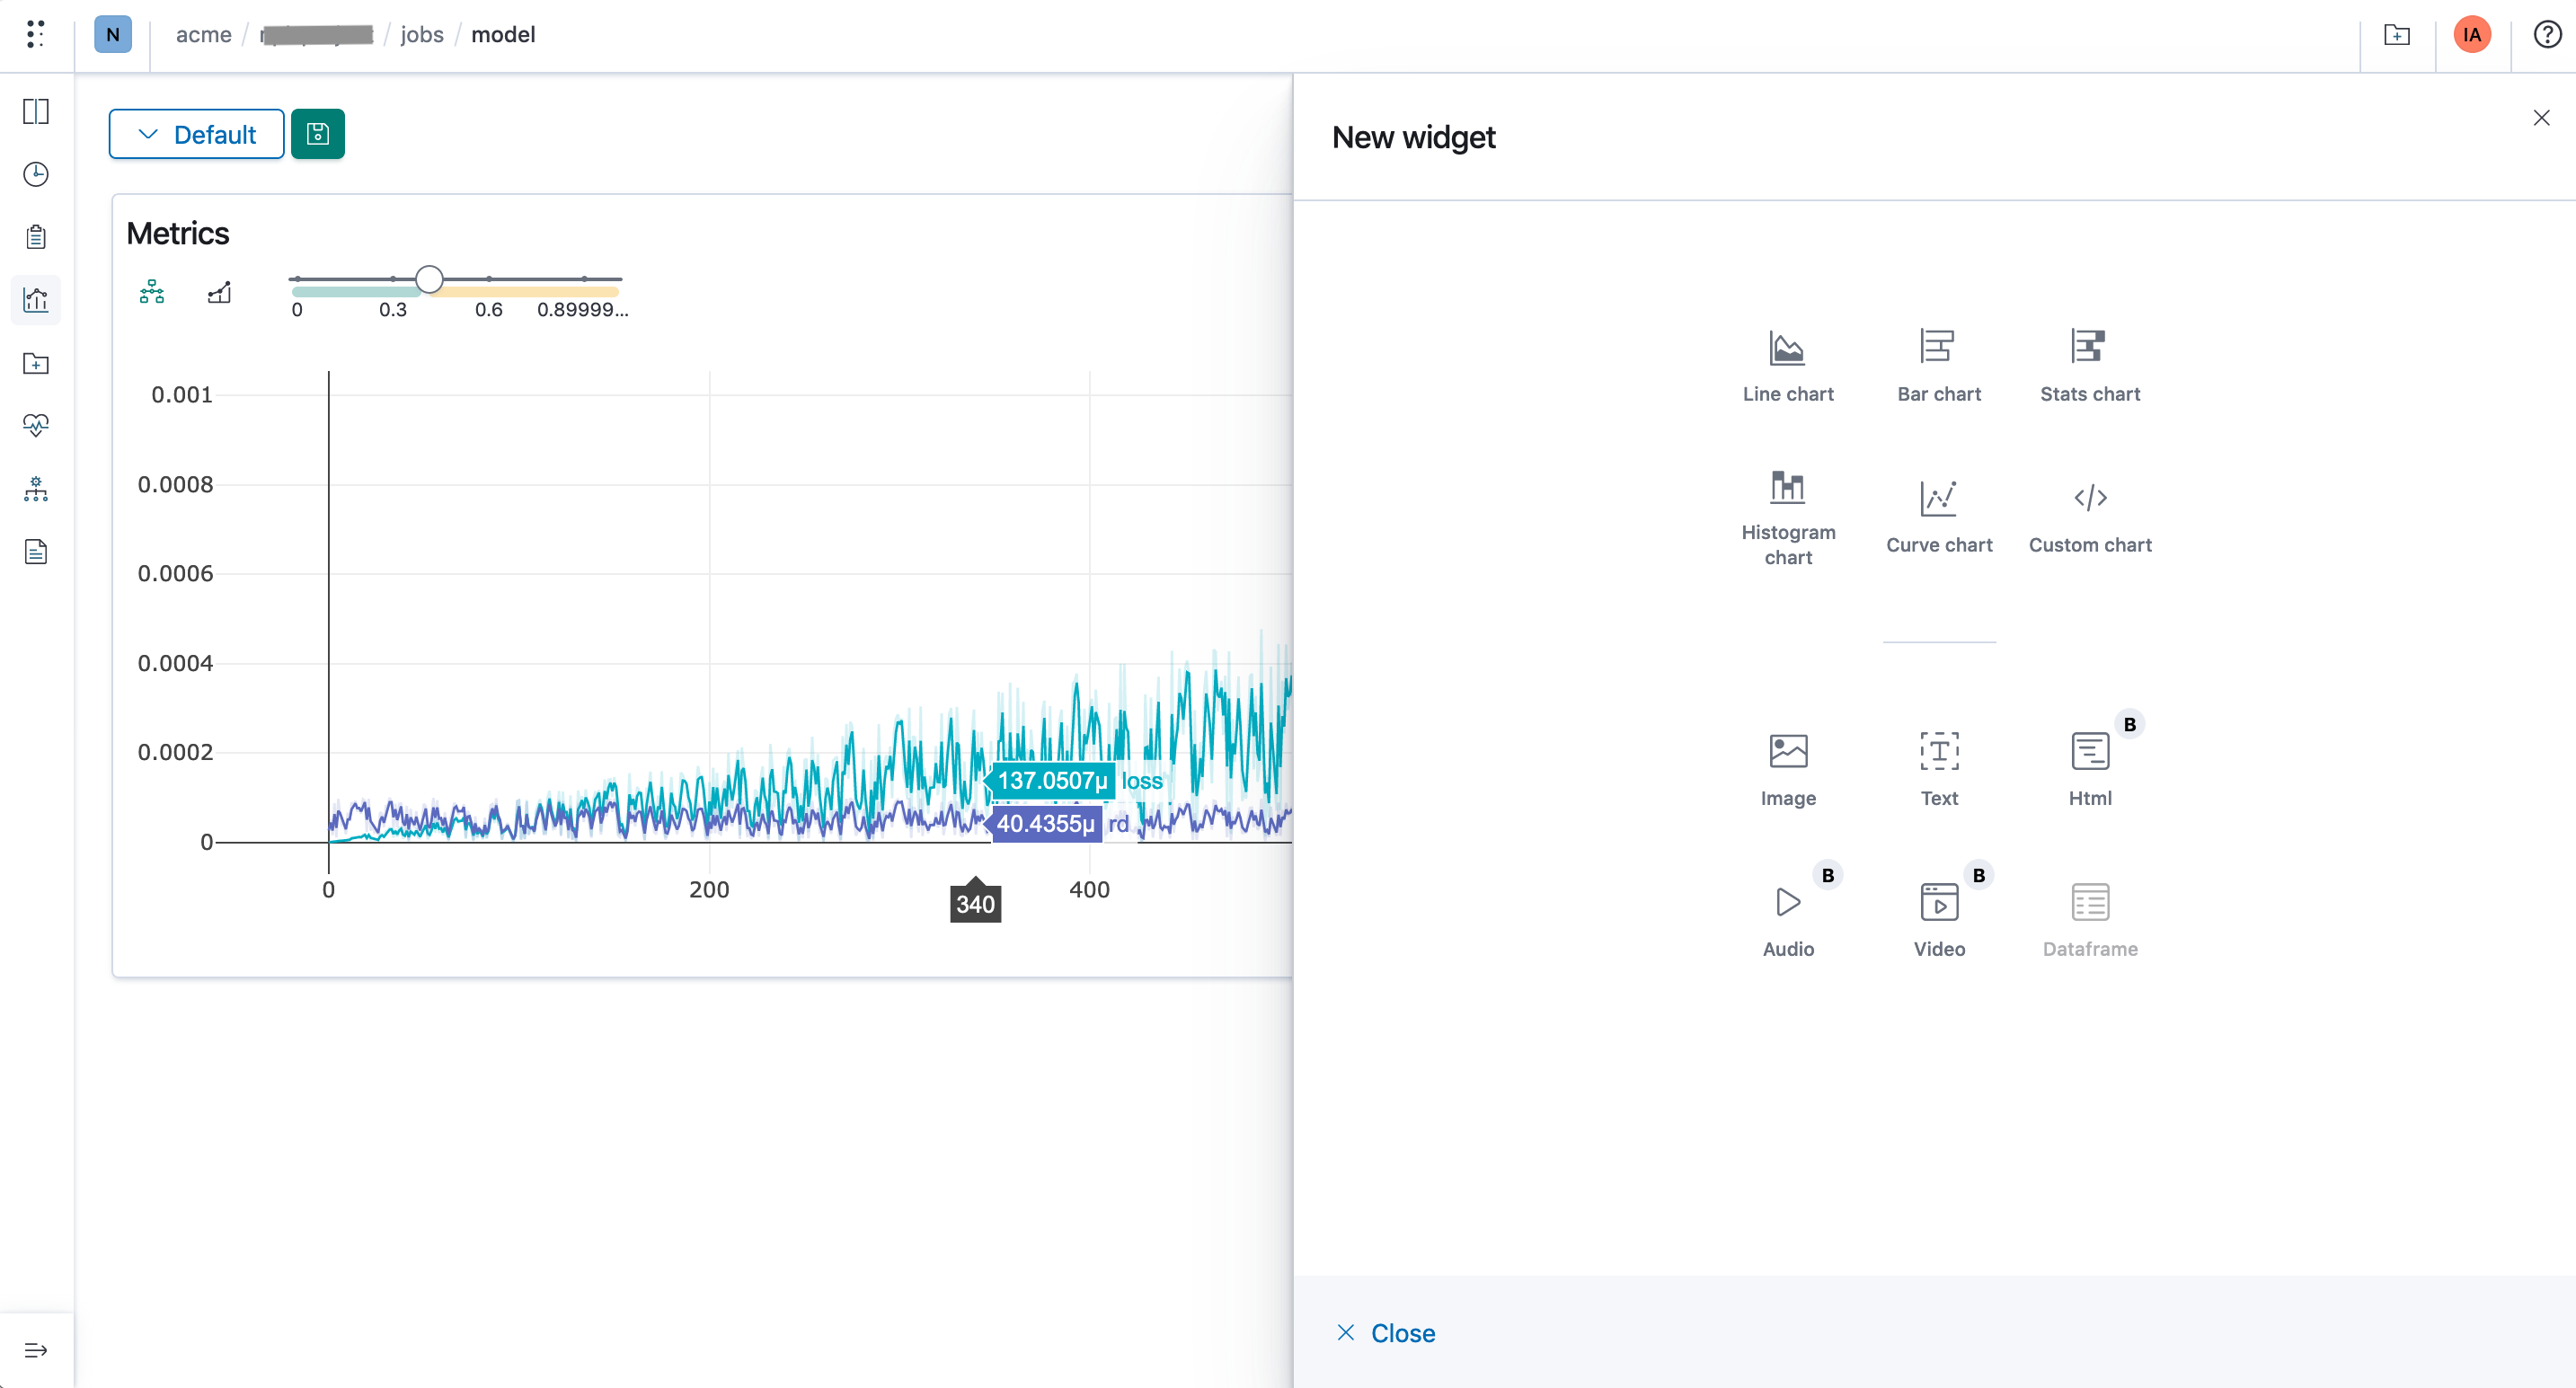
The dashboards tab is a powerful tool that comes with several native visualizations, charts, and media widgets.
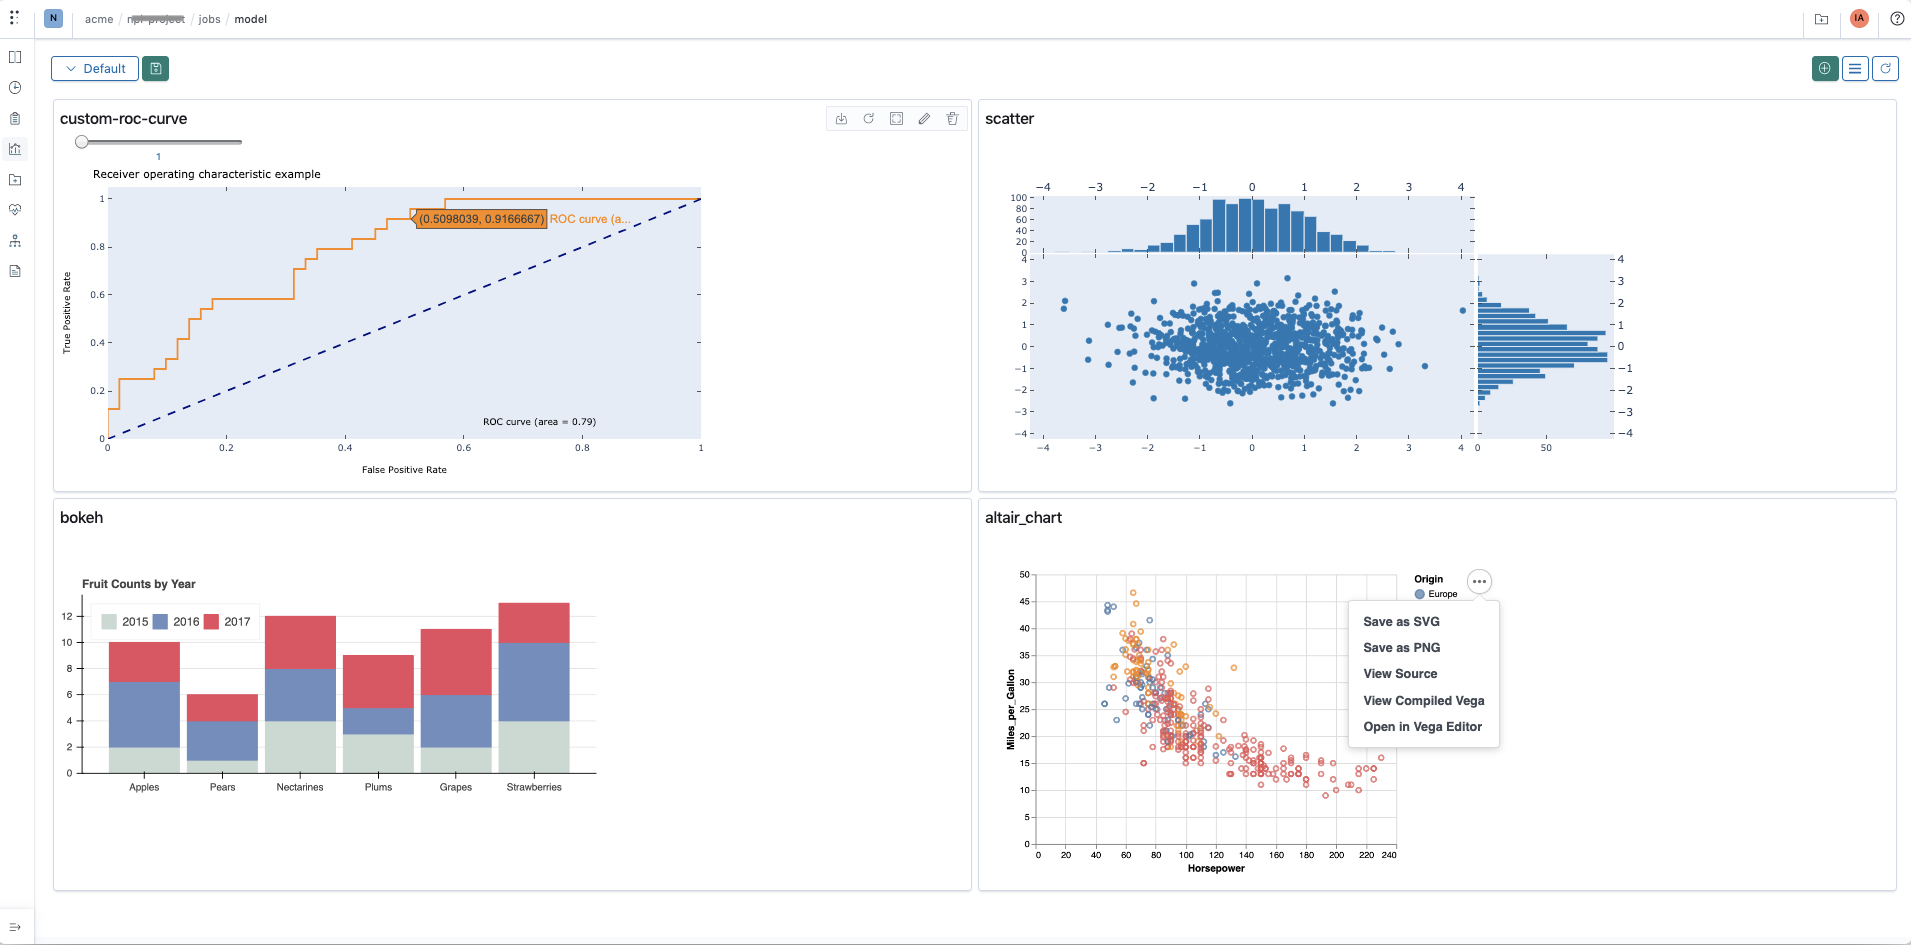
Custom charts
Polyaxon supports rendering visualizations with Plotly, Bokeh, Vega.
Tensorboard and custom apps
You can also run tensorboard for more visualizations power
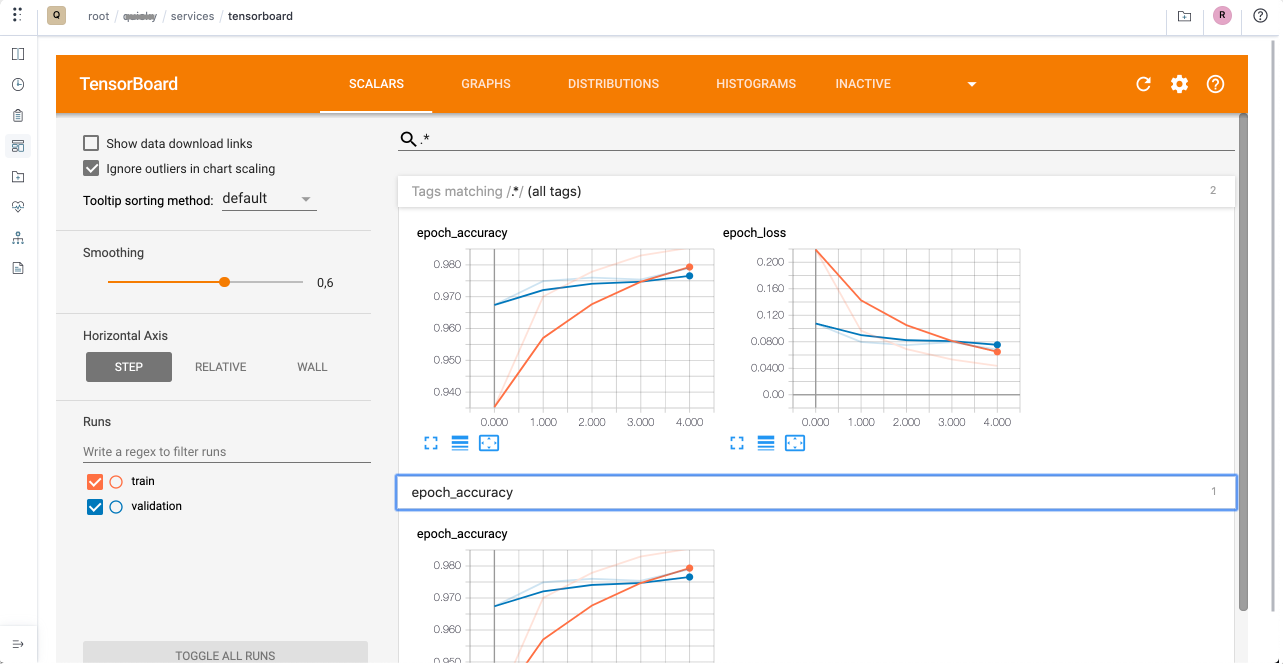
Tensorboard integration provides several possibilities to start a Tensorboard for runs with specific tags, or based on the performance of a specific metric(s).
Please see visualization section for more information