Overview
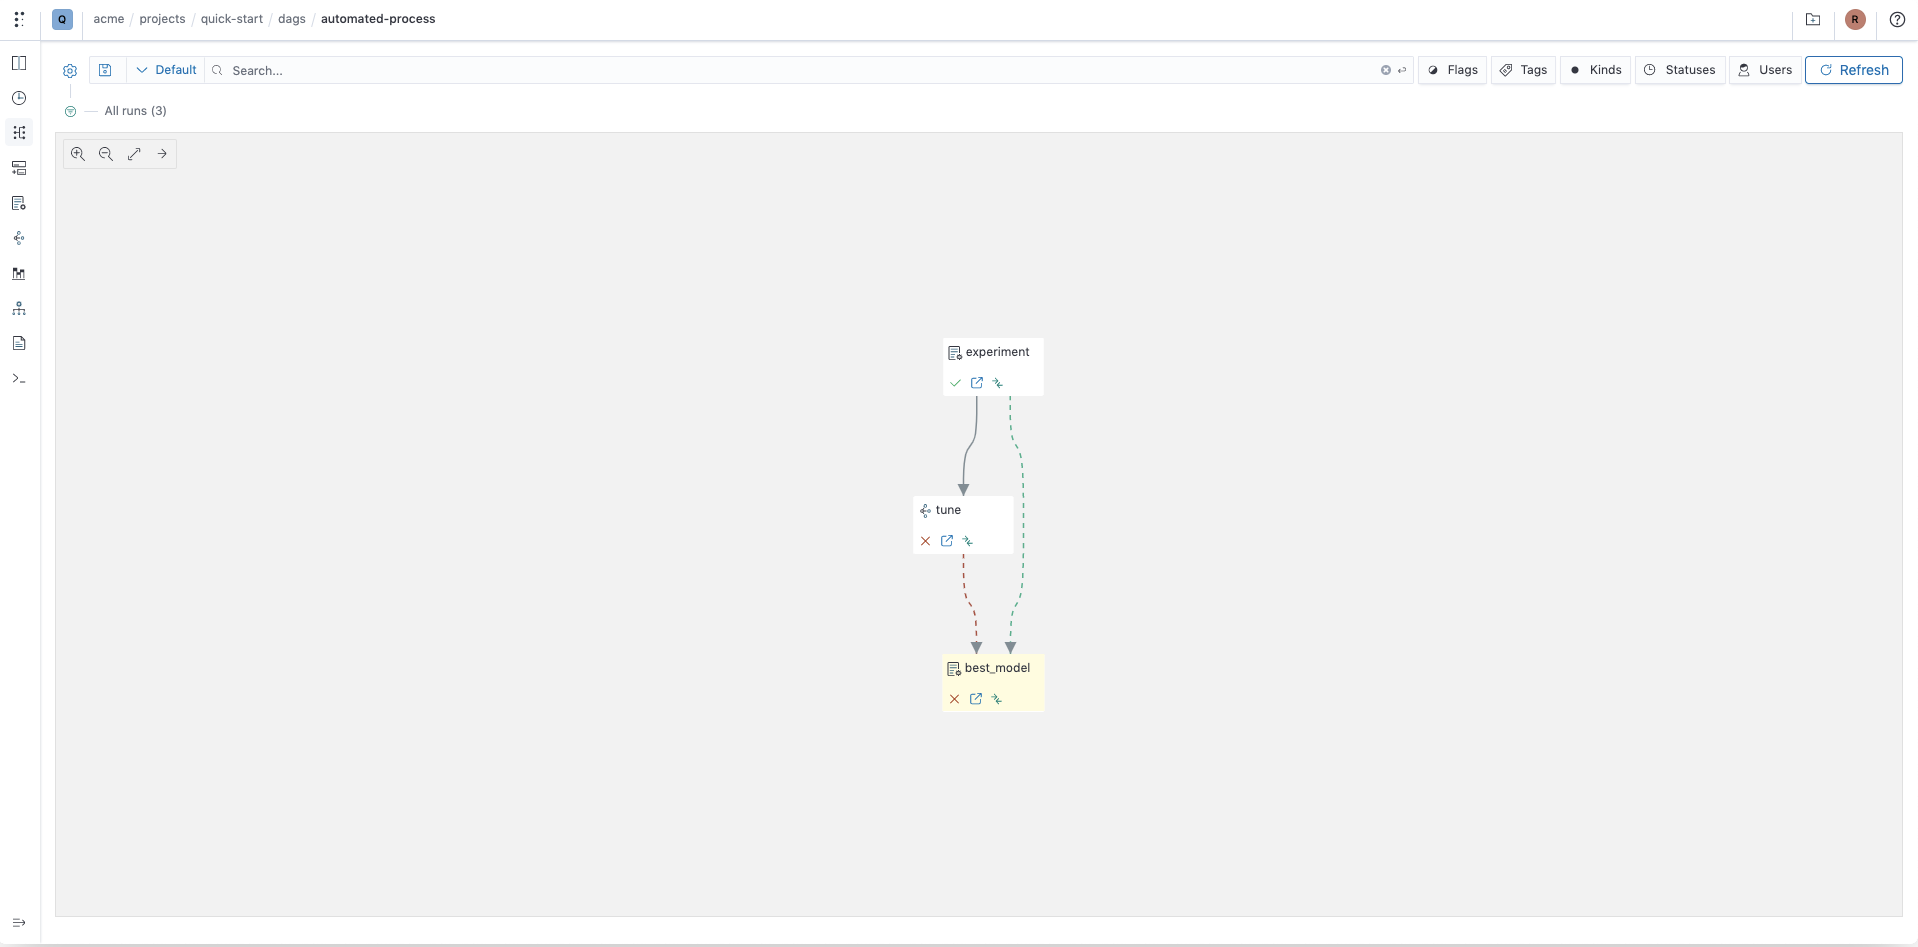
The graph view is a powerful tool for listing, filtering, and comparing runs of all kinds under the same pipeline following their dependencies.
Feature
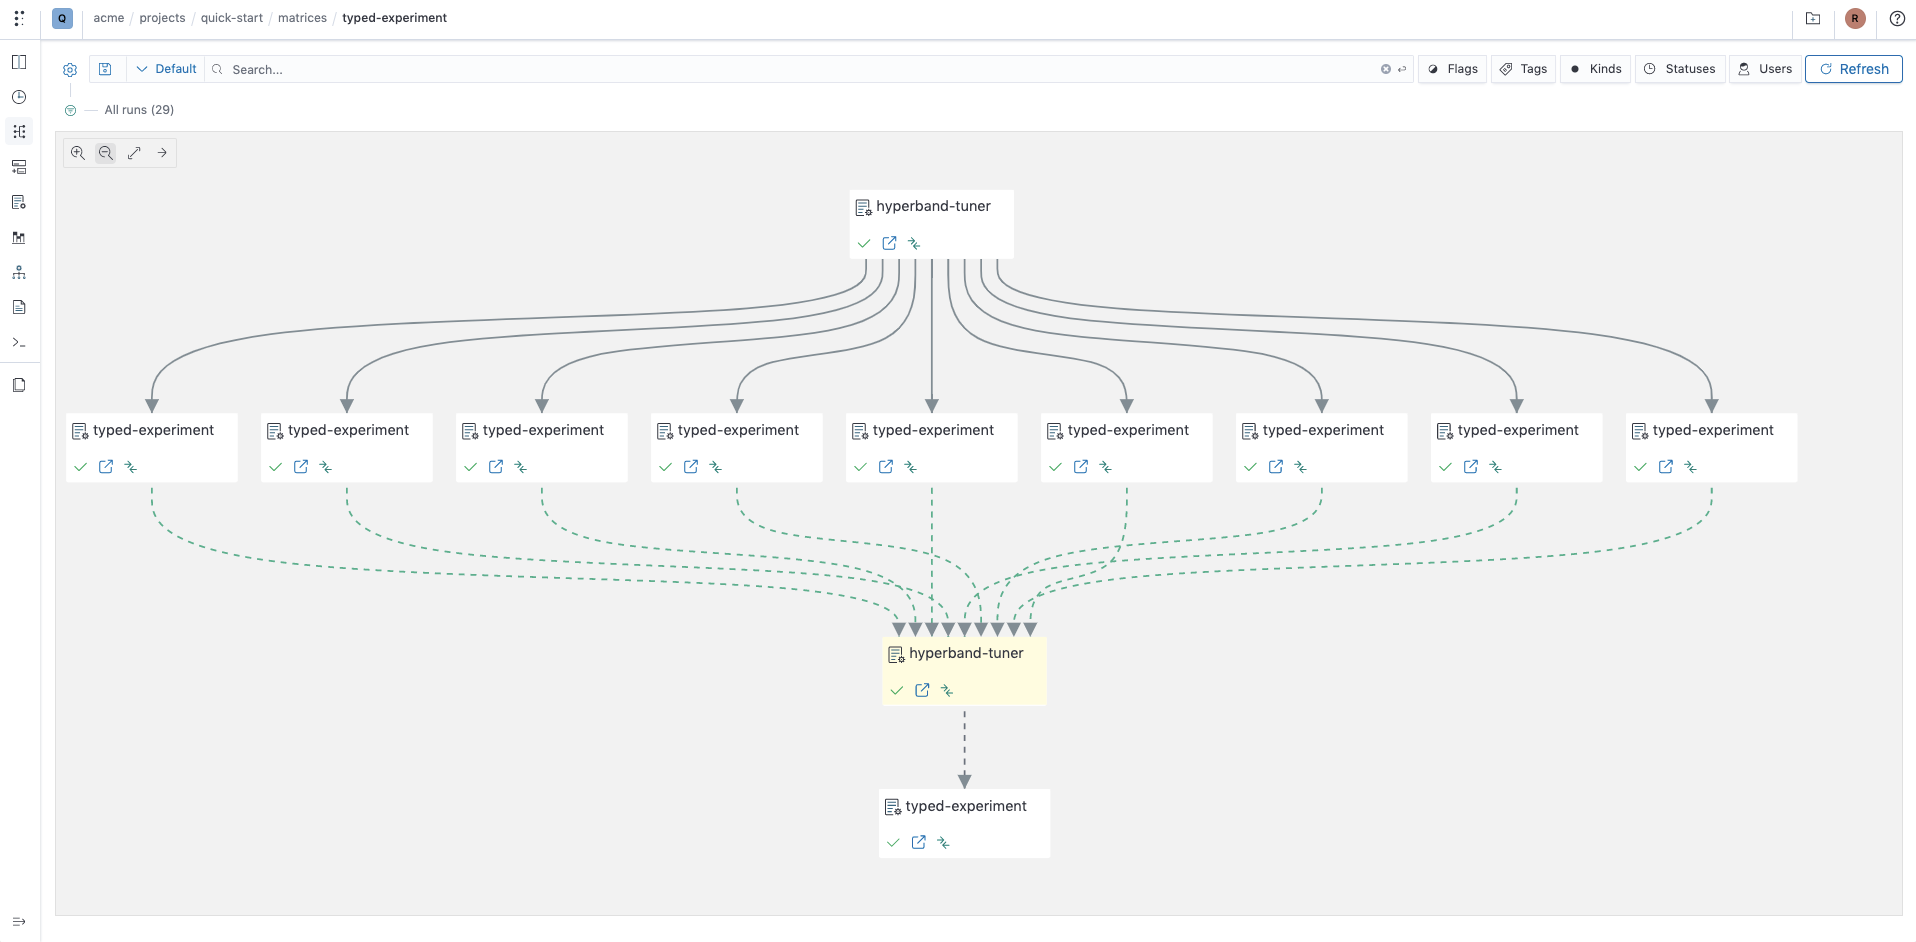
The graph view provides similar features as the timeline view, but instead of showing a table it shows a dependency graph, you can zoom in, zoom out, fit the graph, and open operations in flyout :
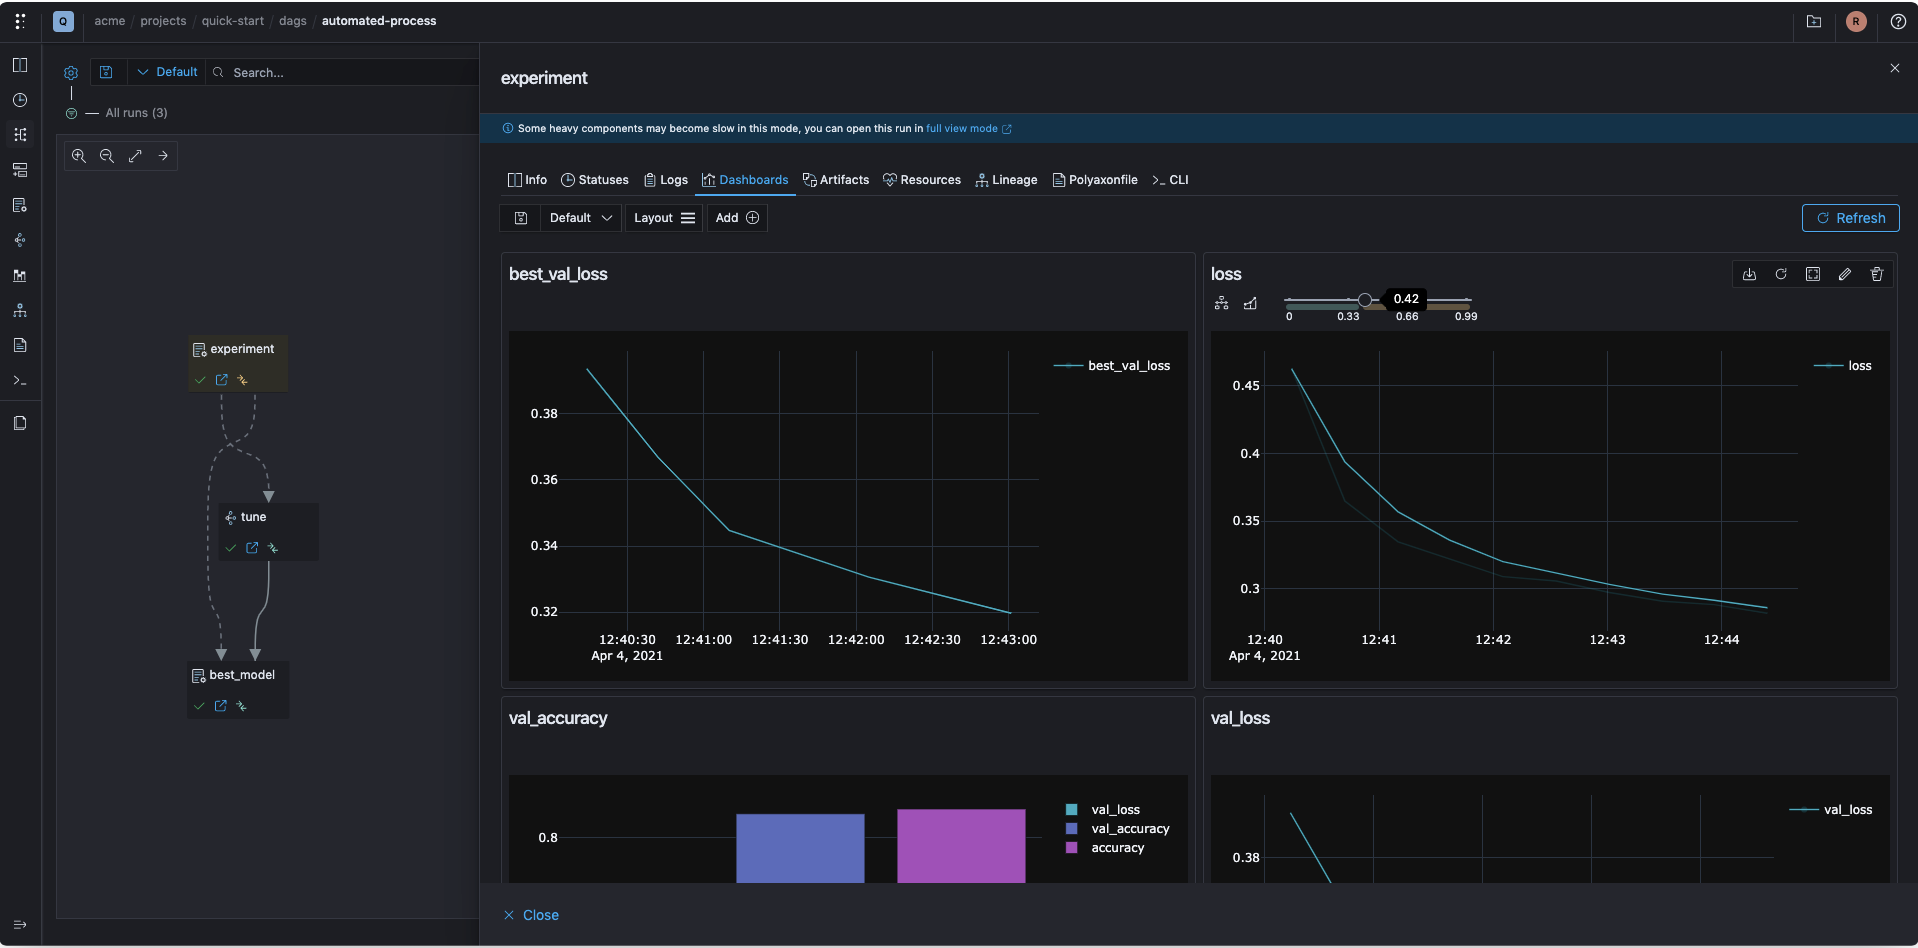
The graph view comes with two direction:
rightdirection for deep graphs
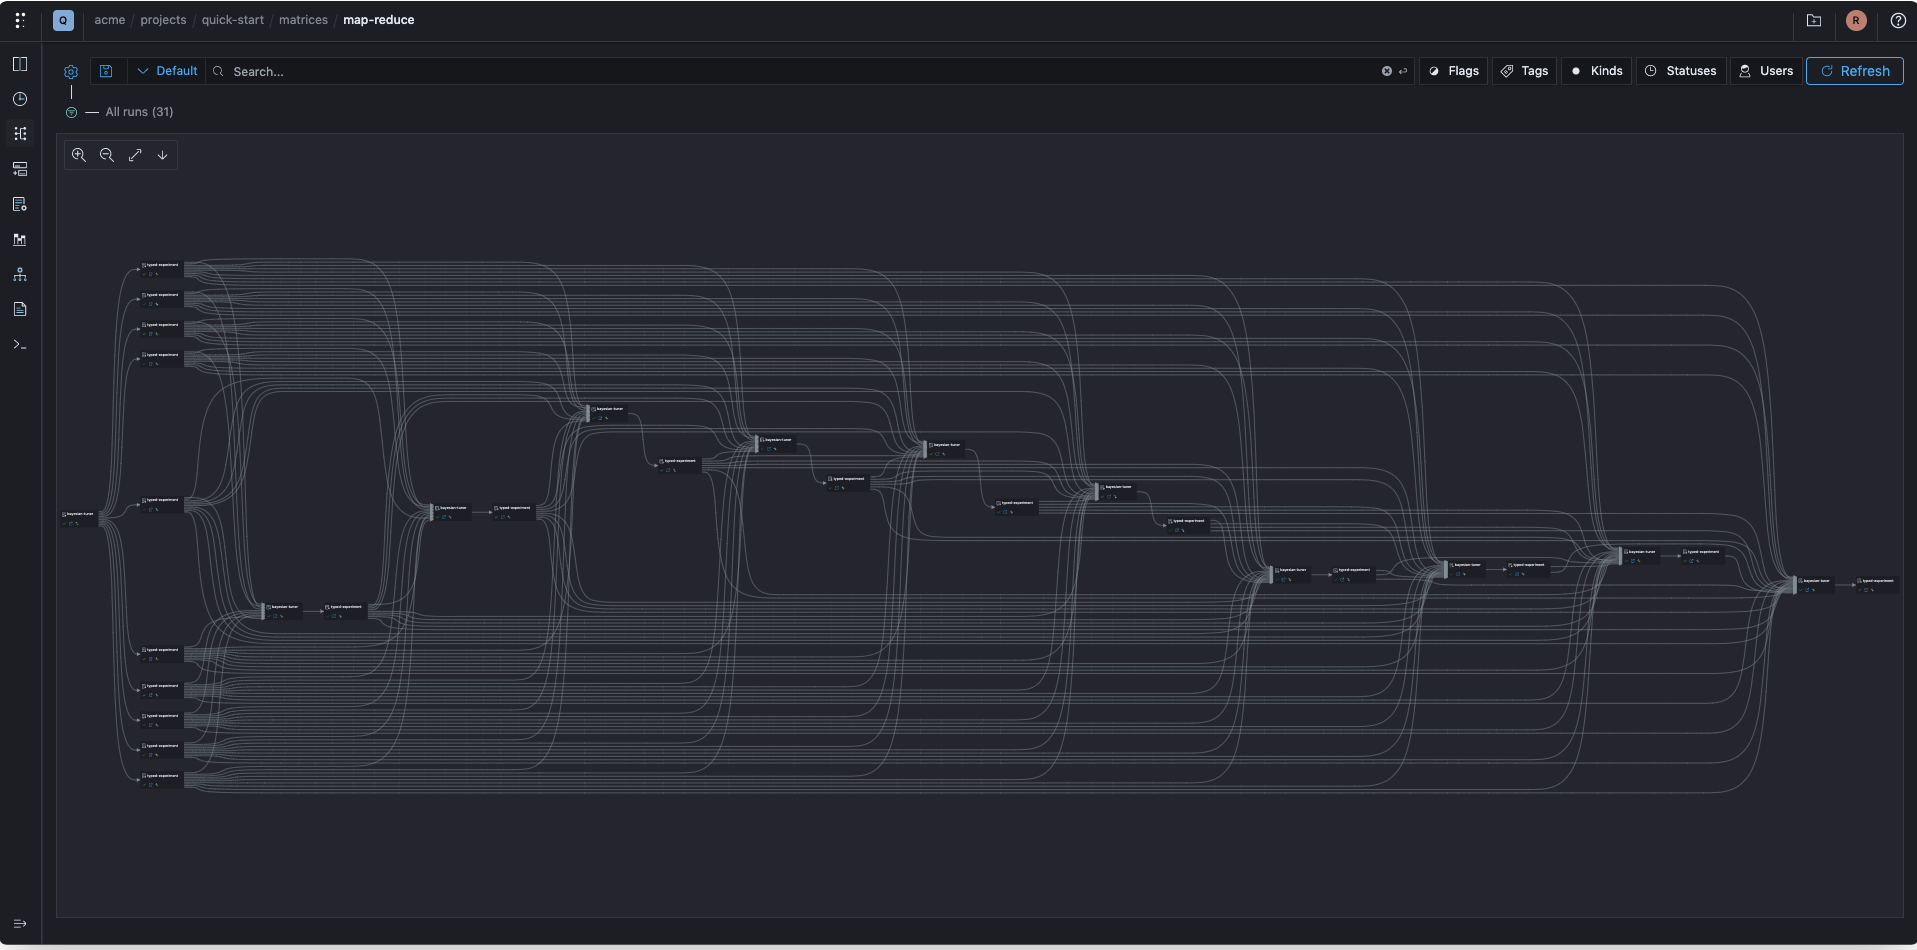
downdirection for wide graphs
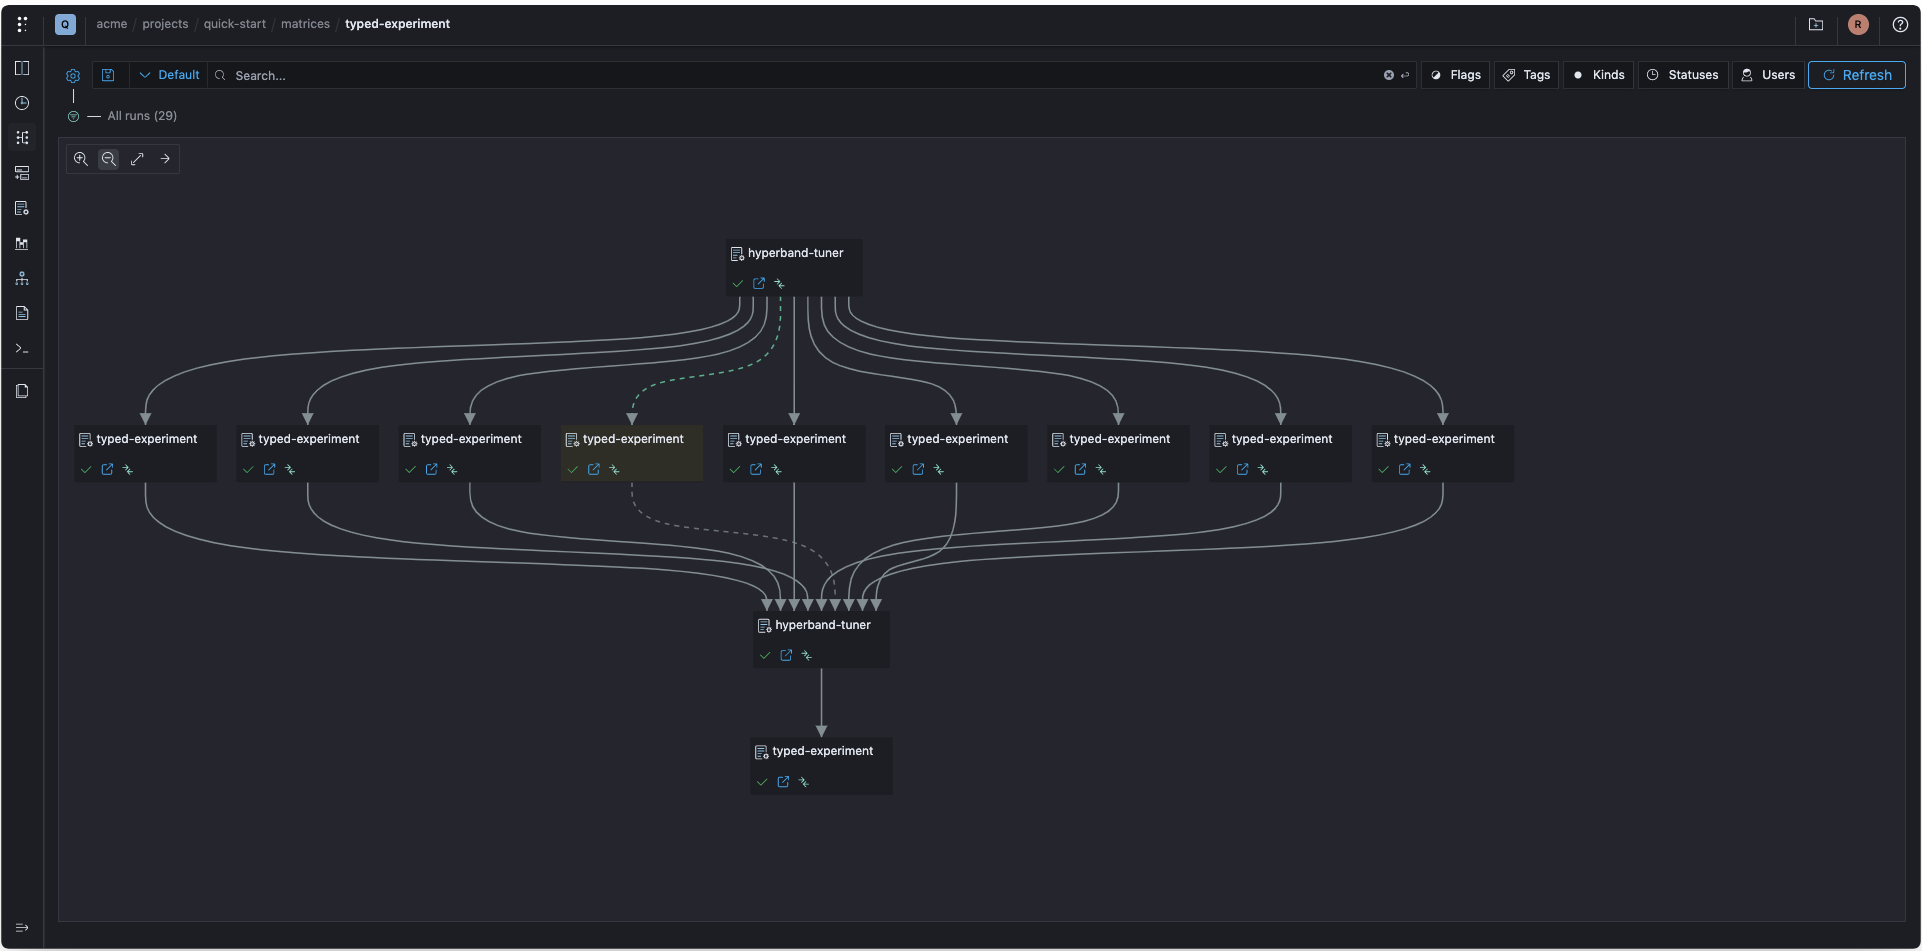
When hovering an operation, the upstream edges are colored based on the status of the upstream operations
If an operation fails you can see all operations that contributed to the upstream-failed status: