Overview
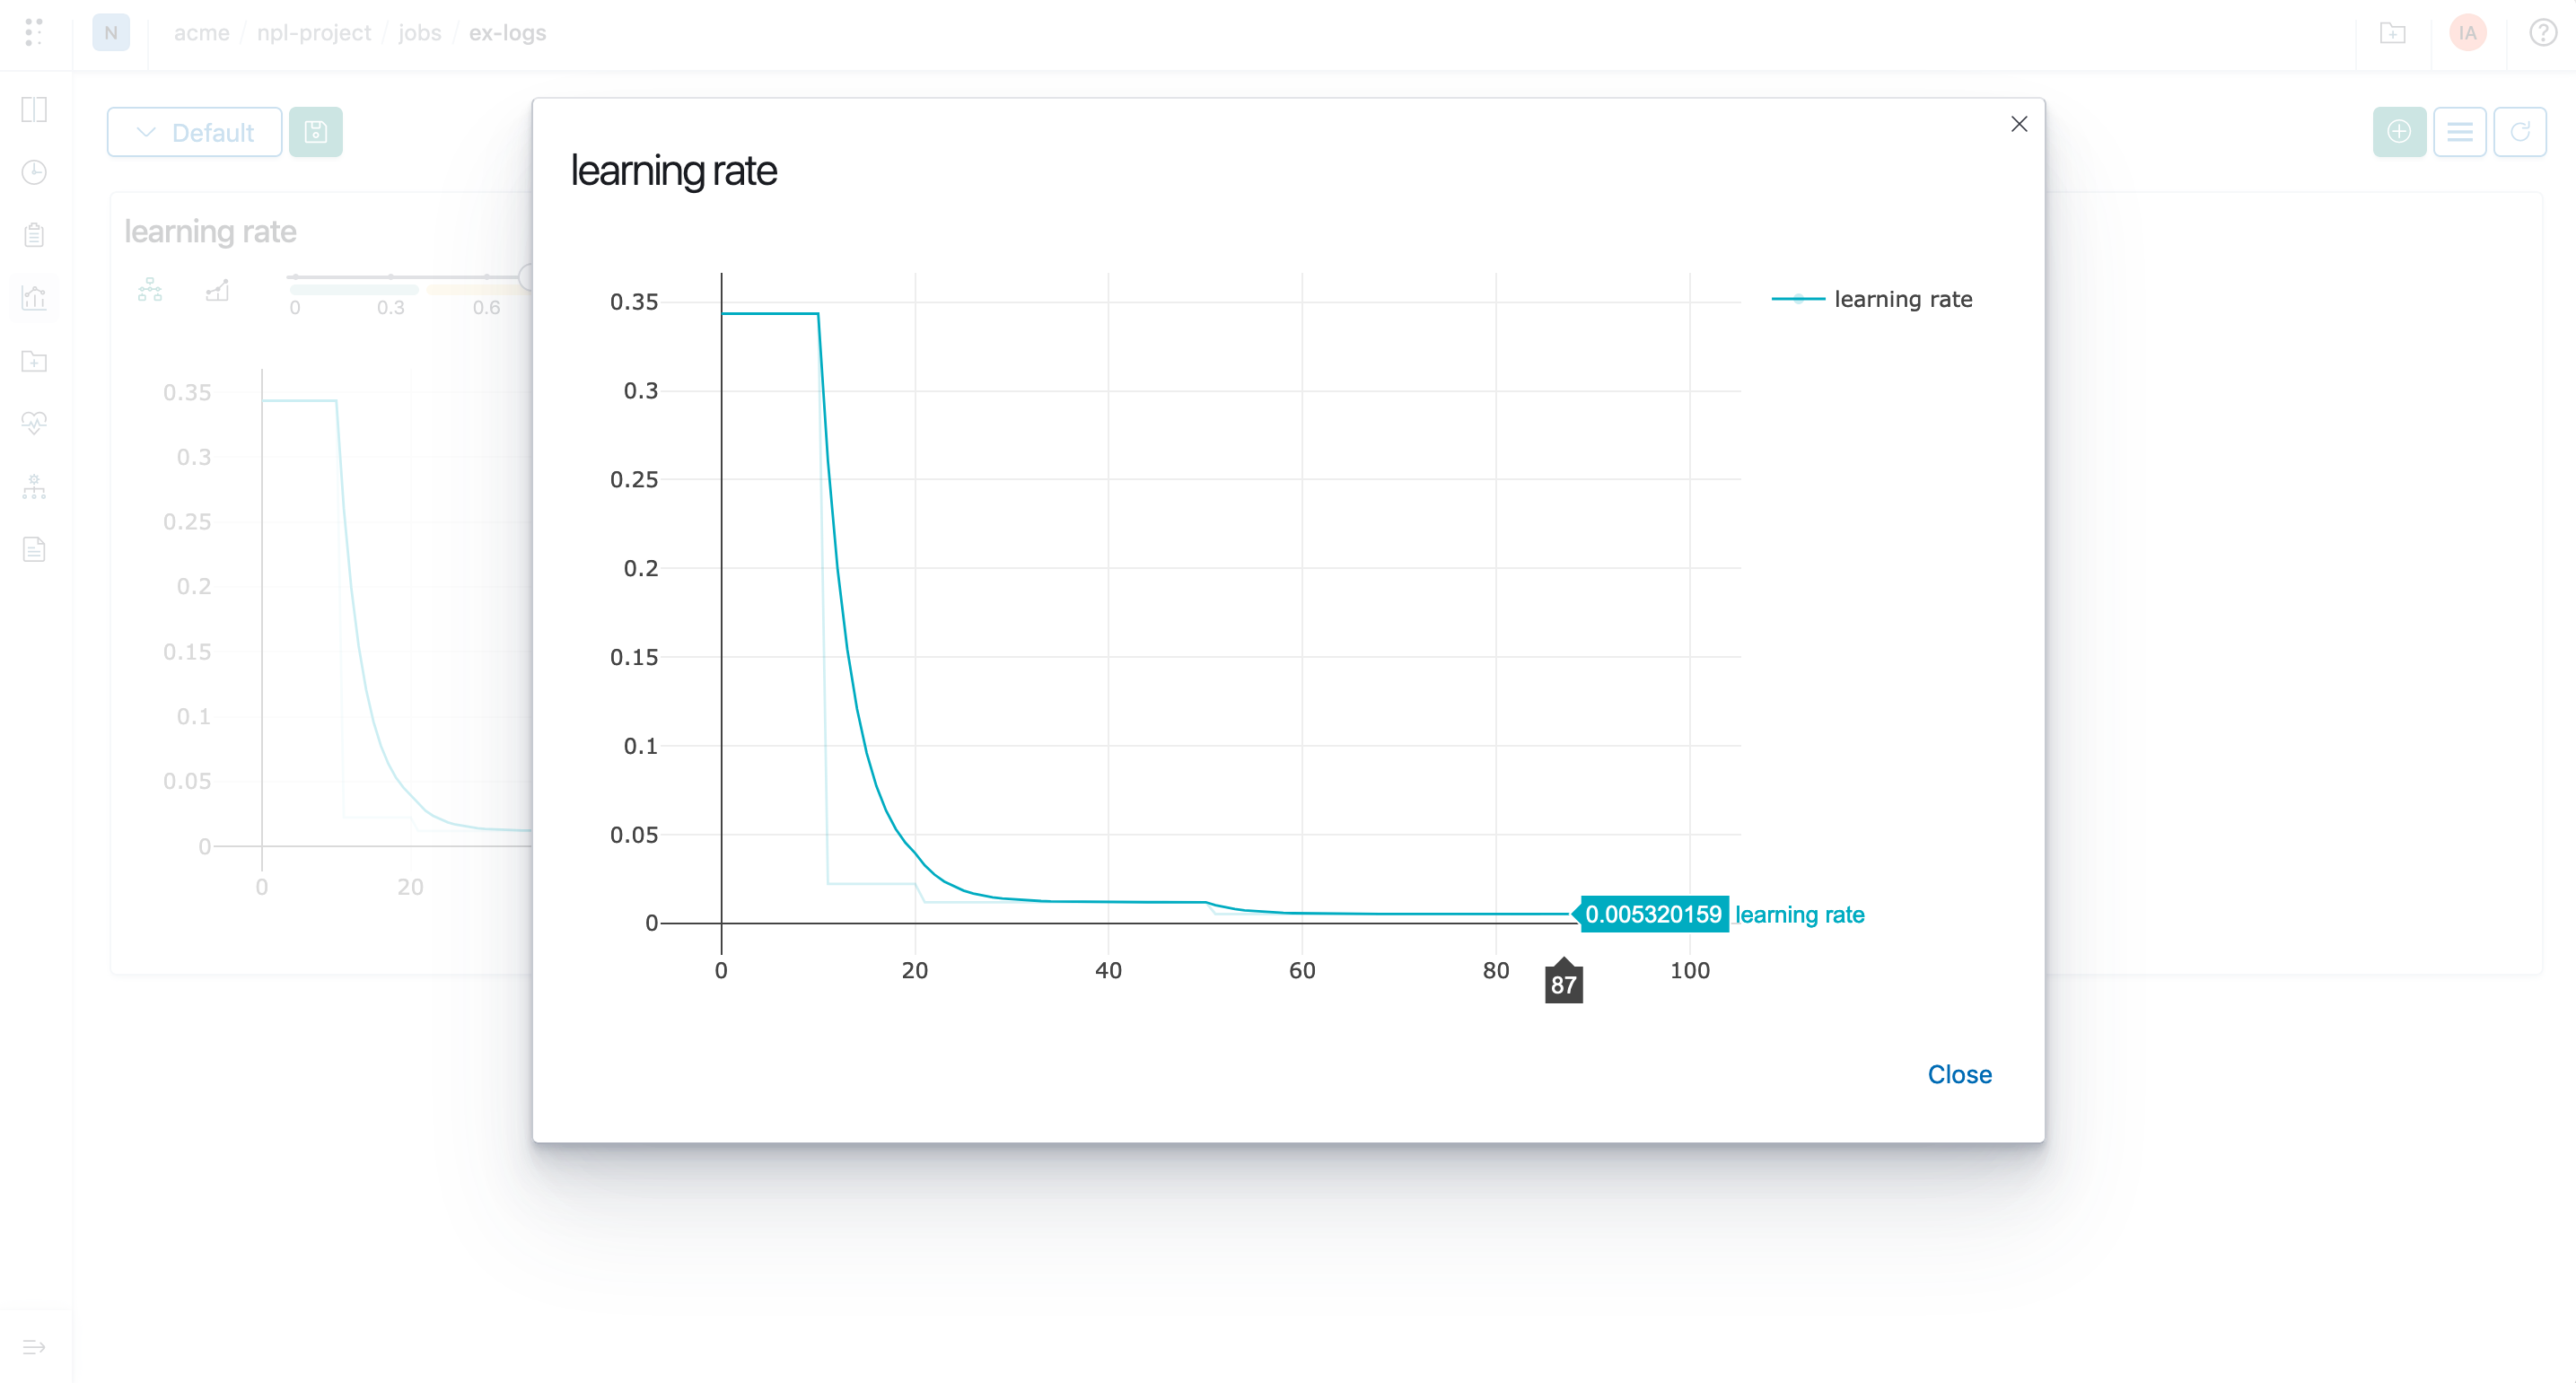
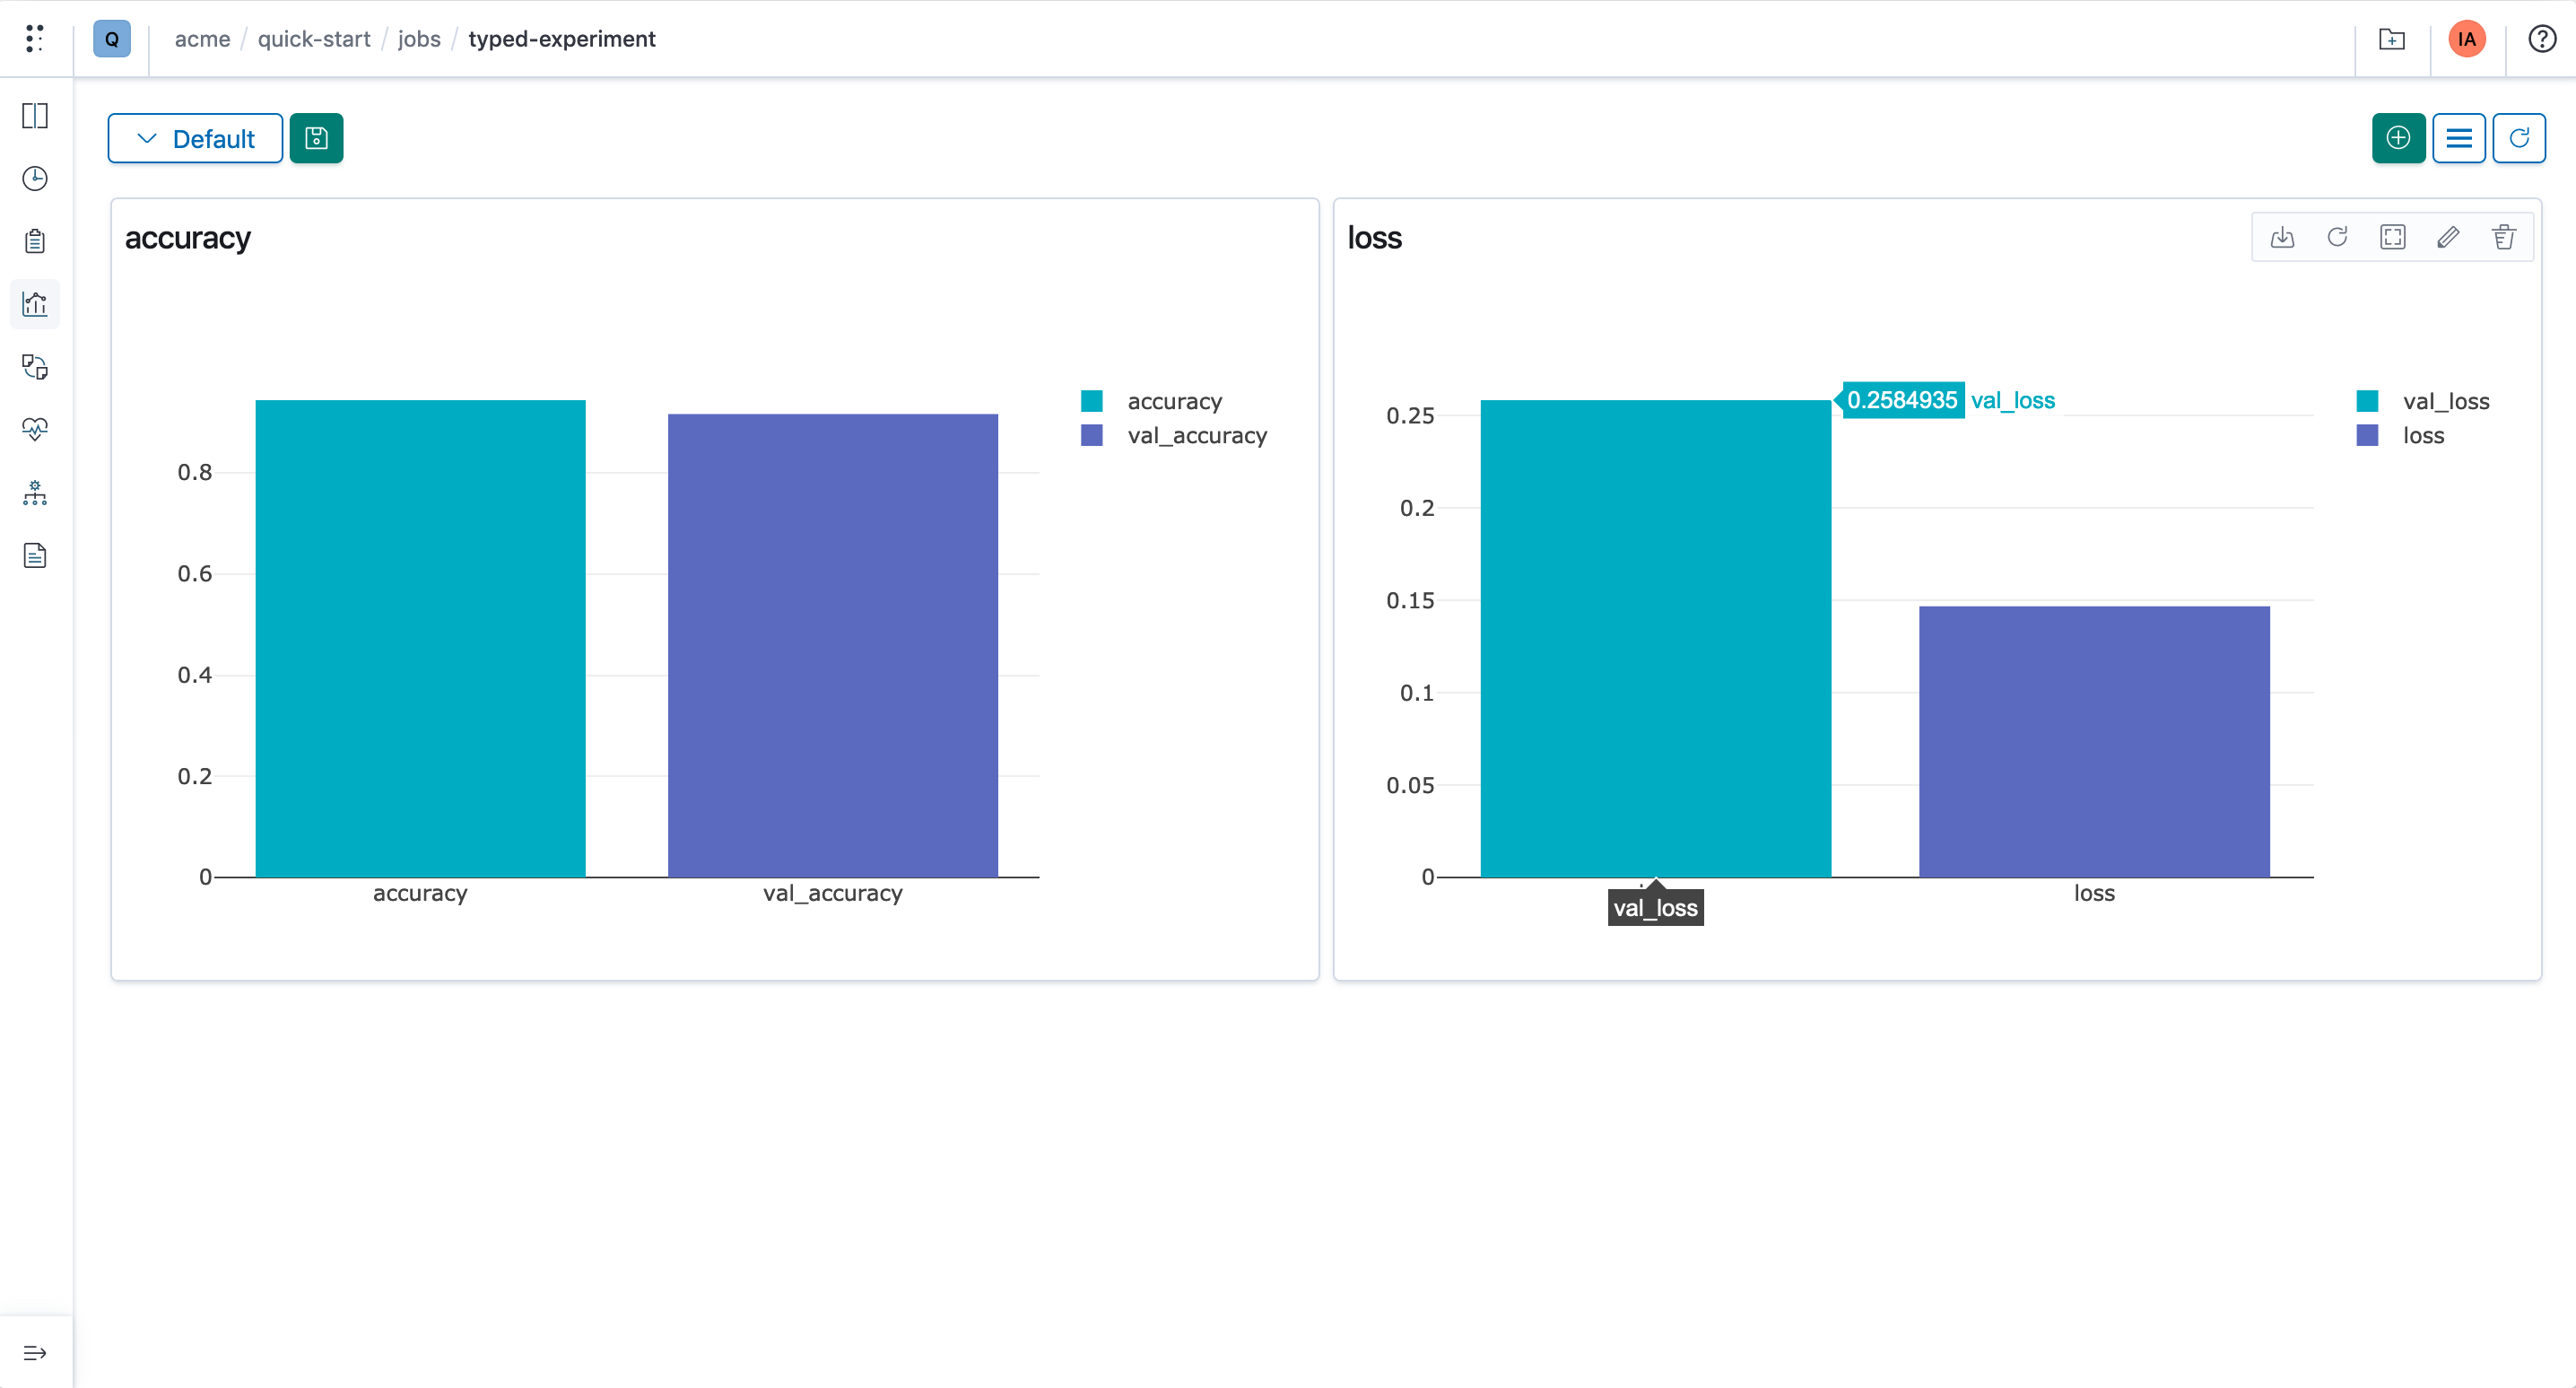
Polyaxon dashboard provides several visualizations and charts based on events logged by the tracking API.
Single runs:
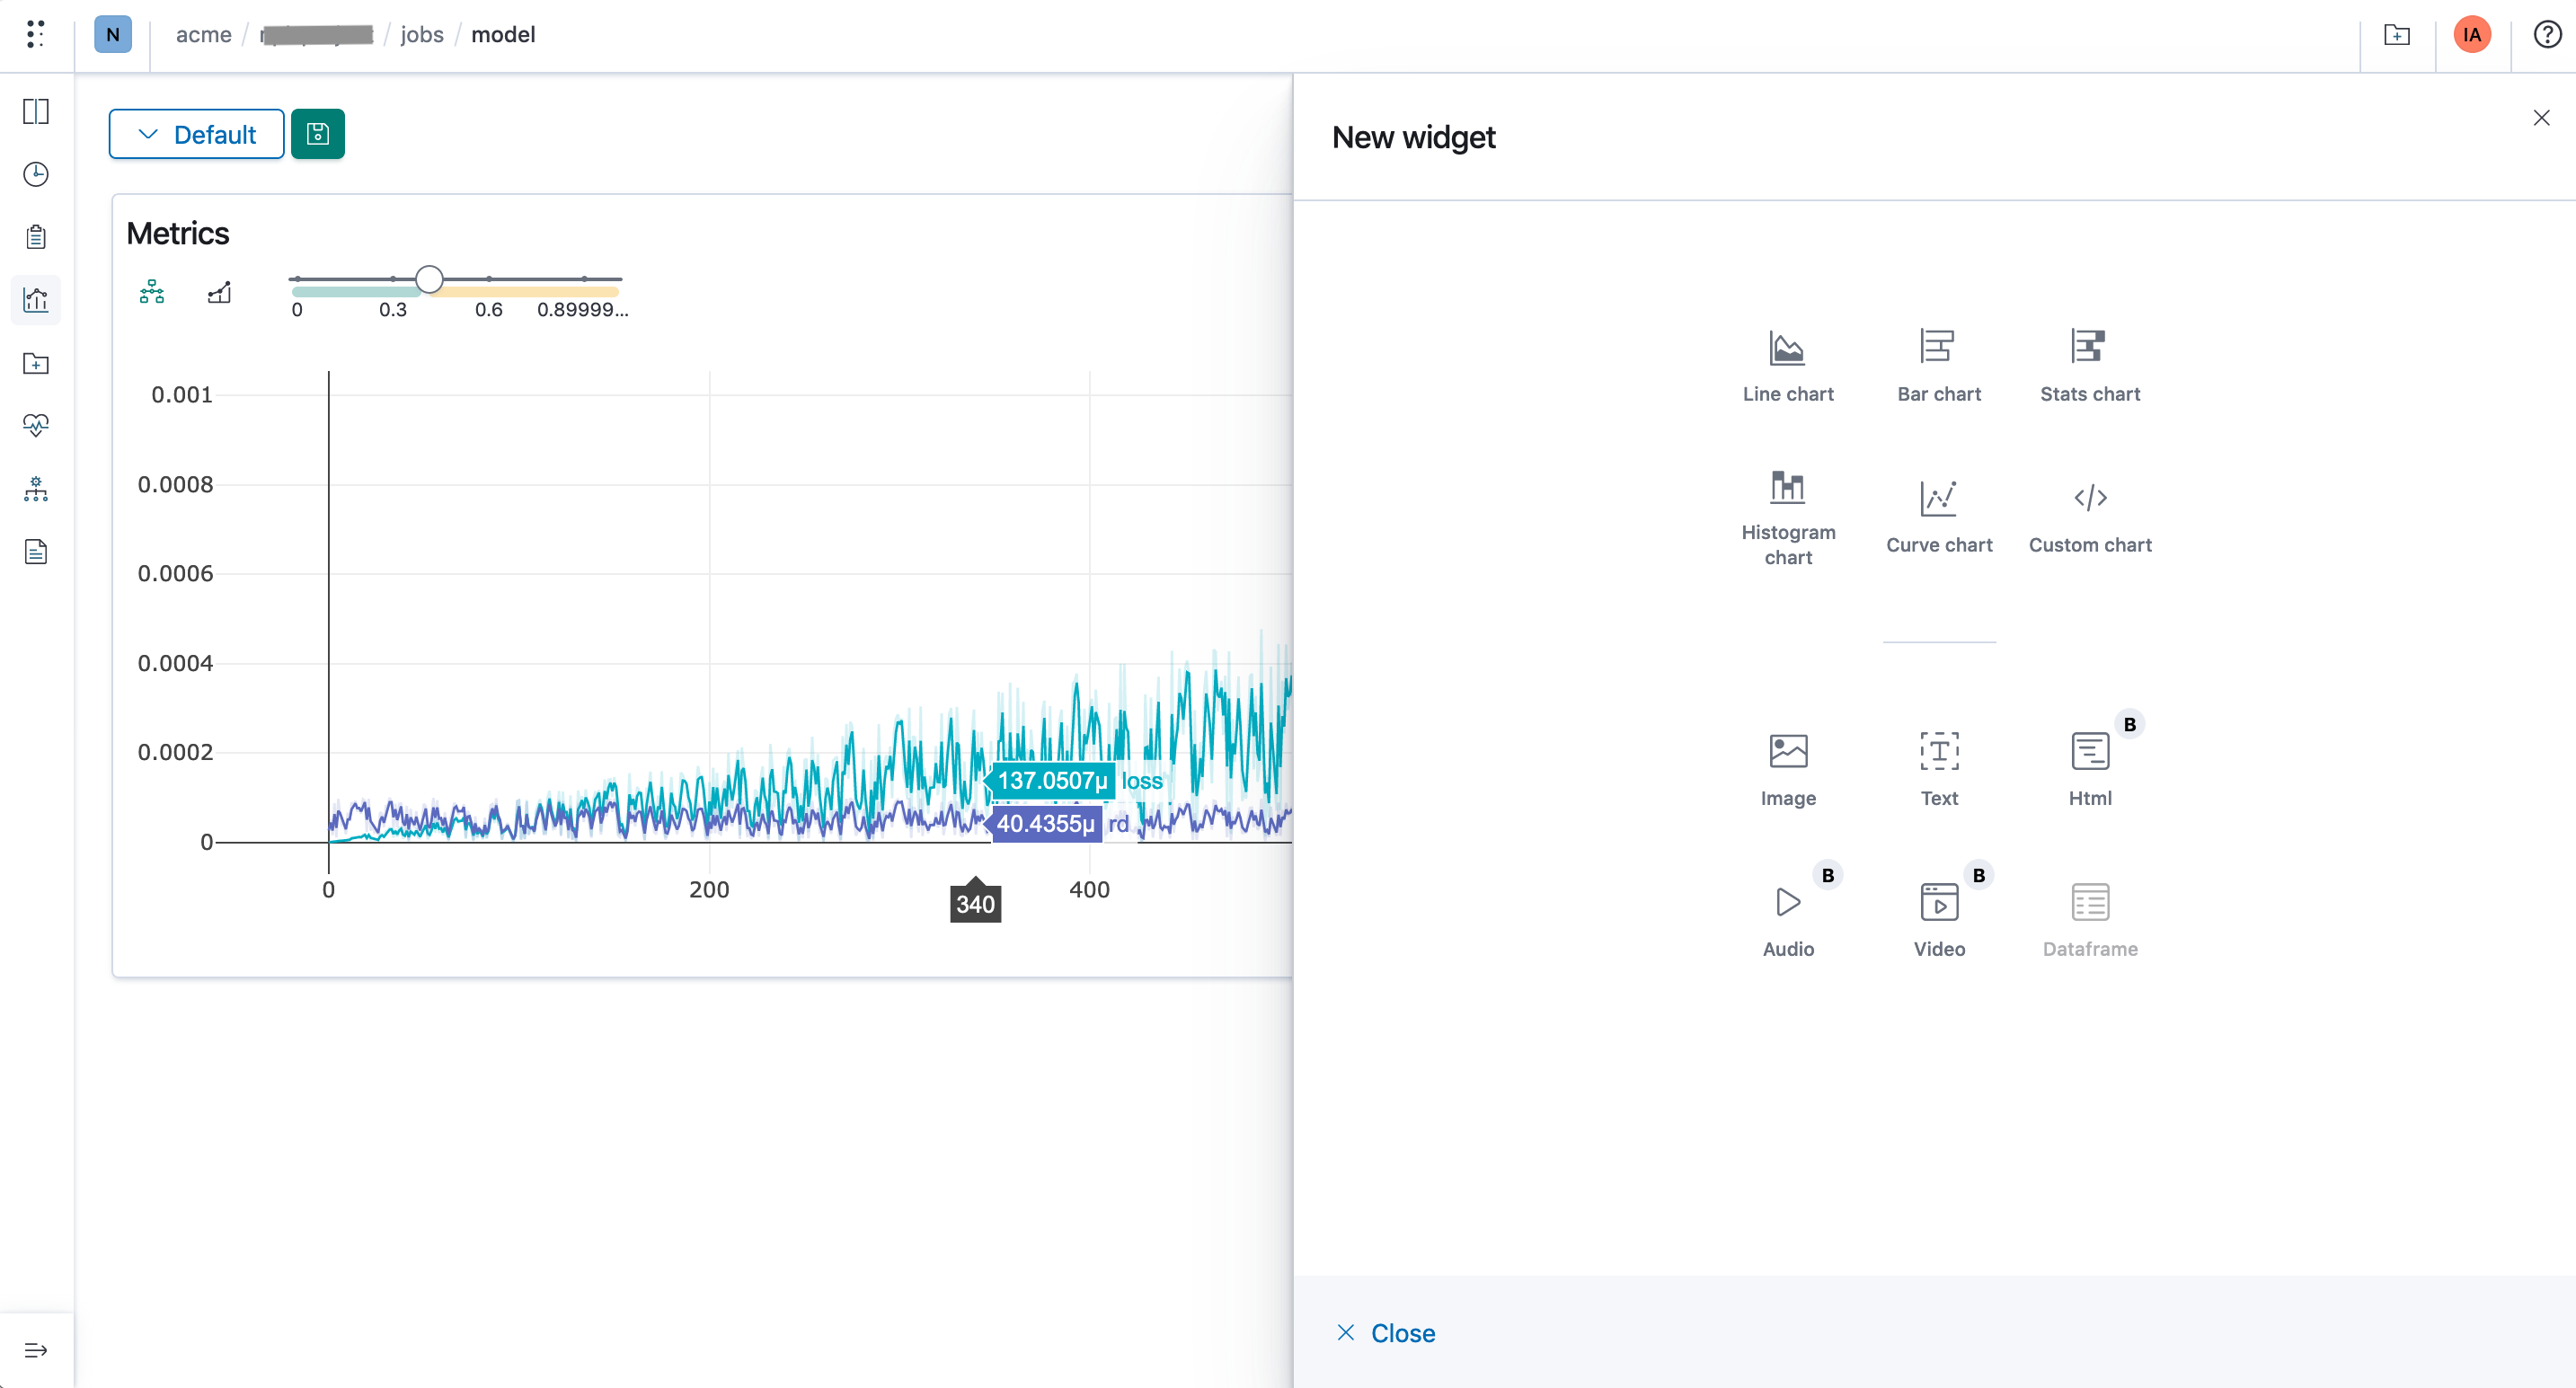
- Line charts
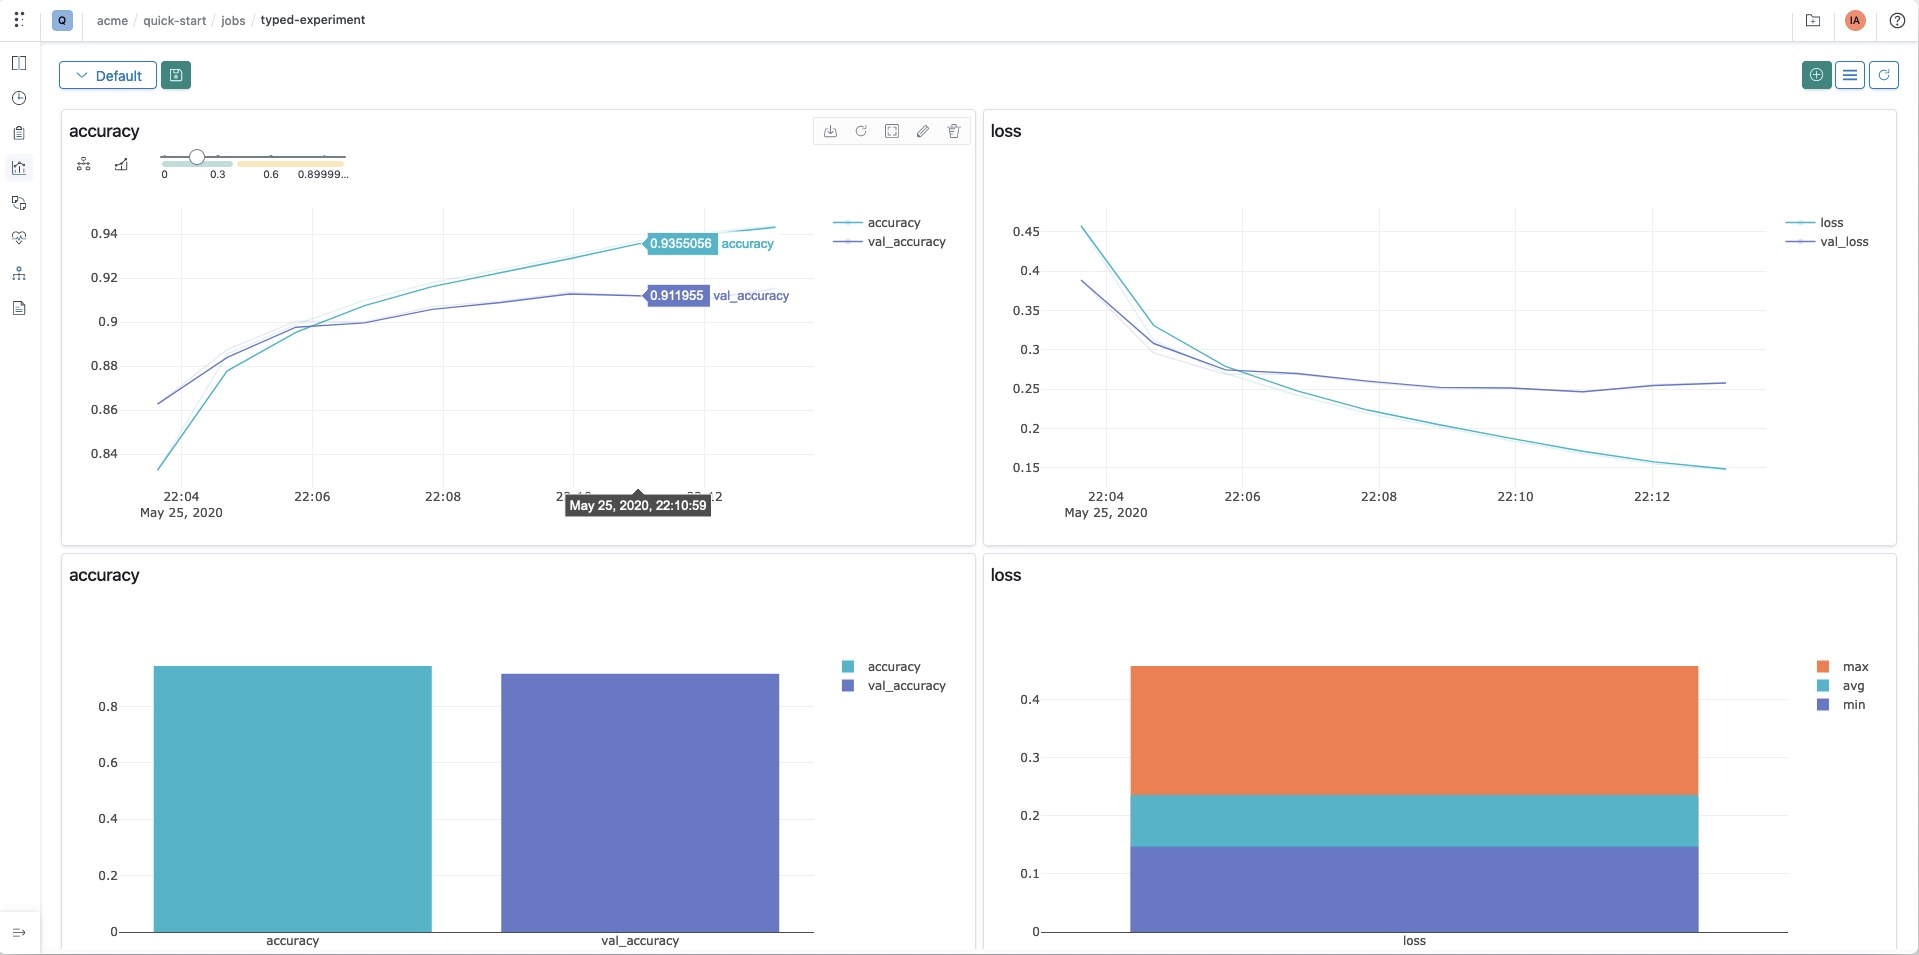
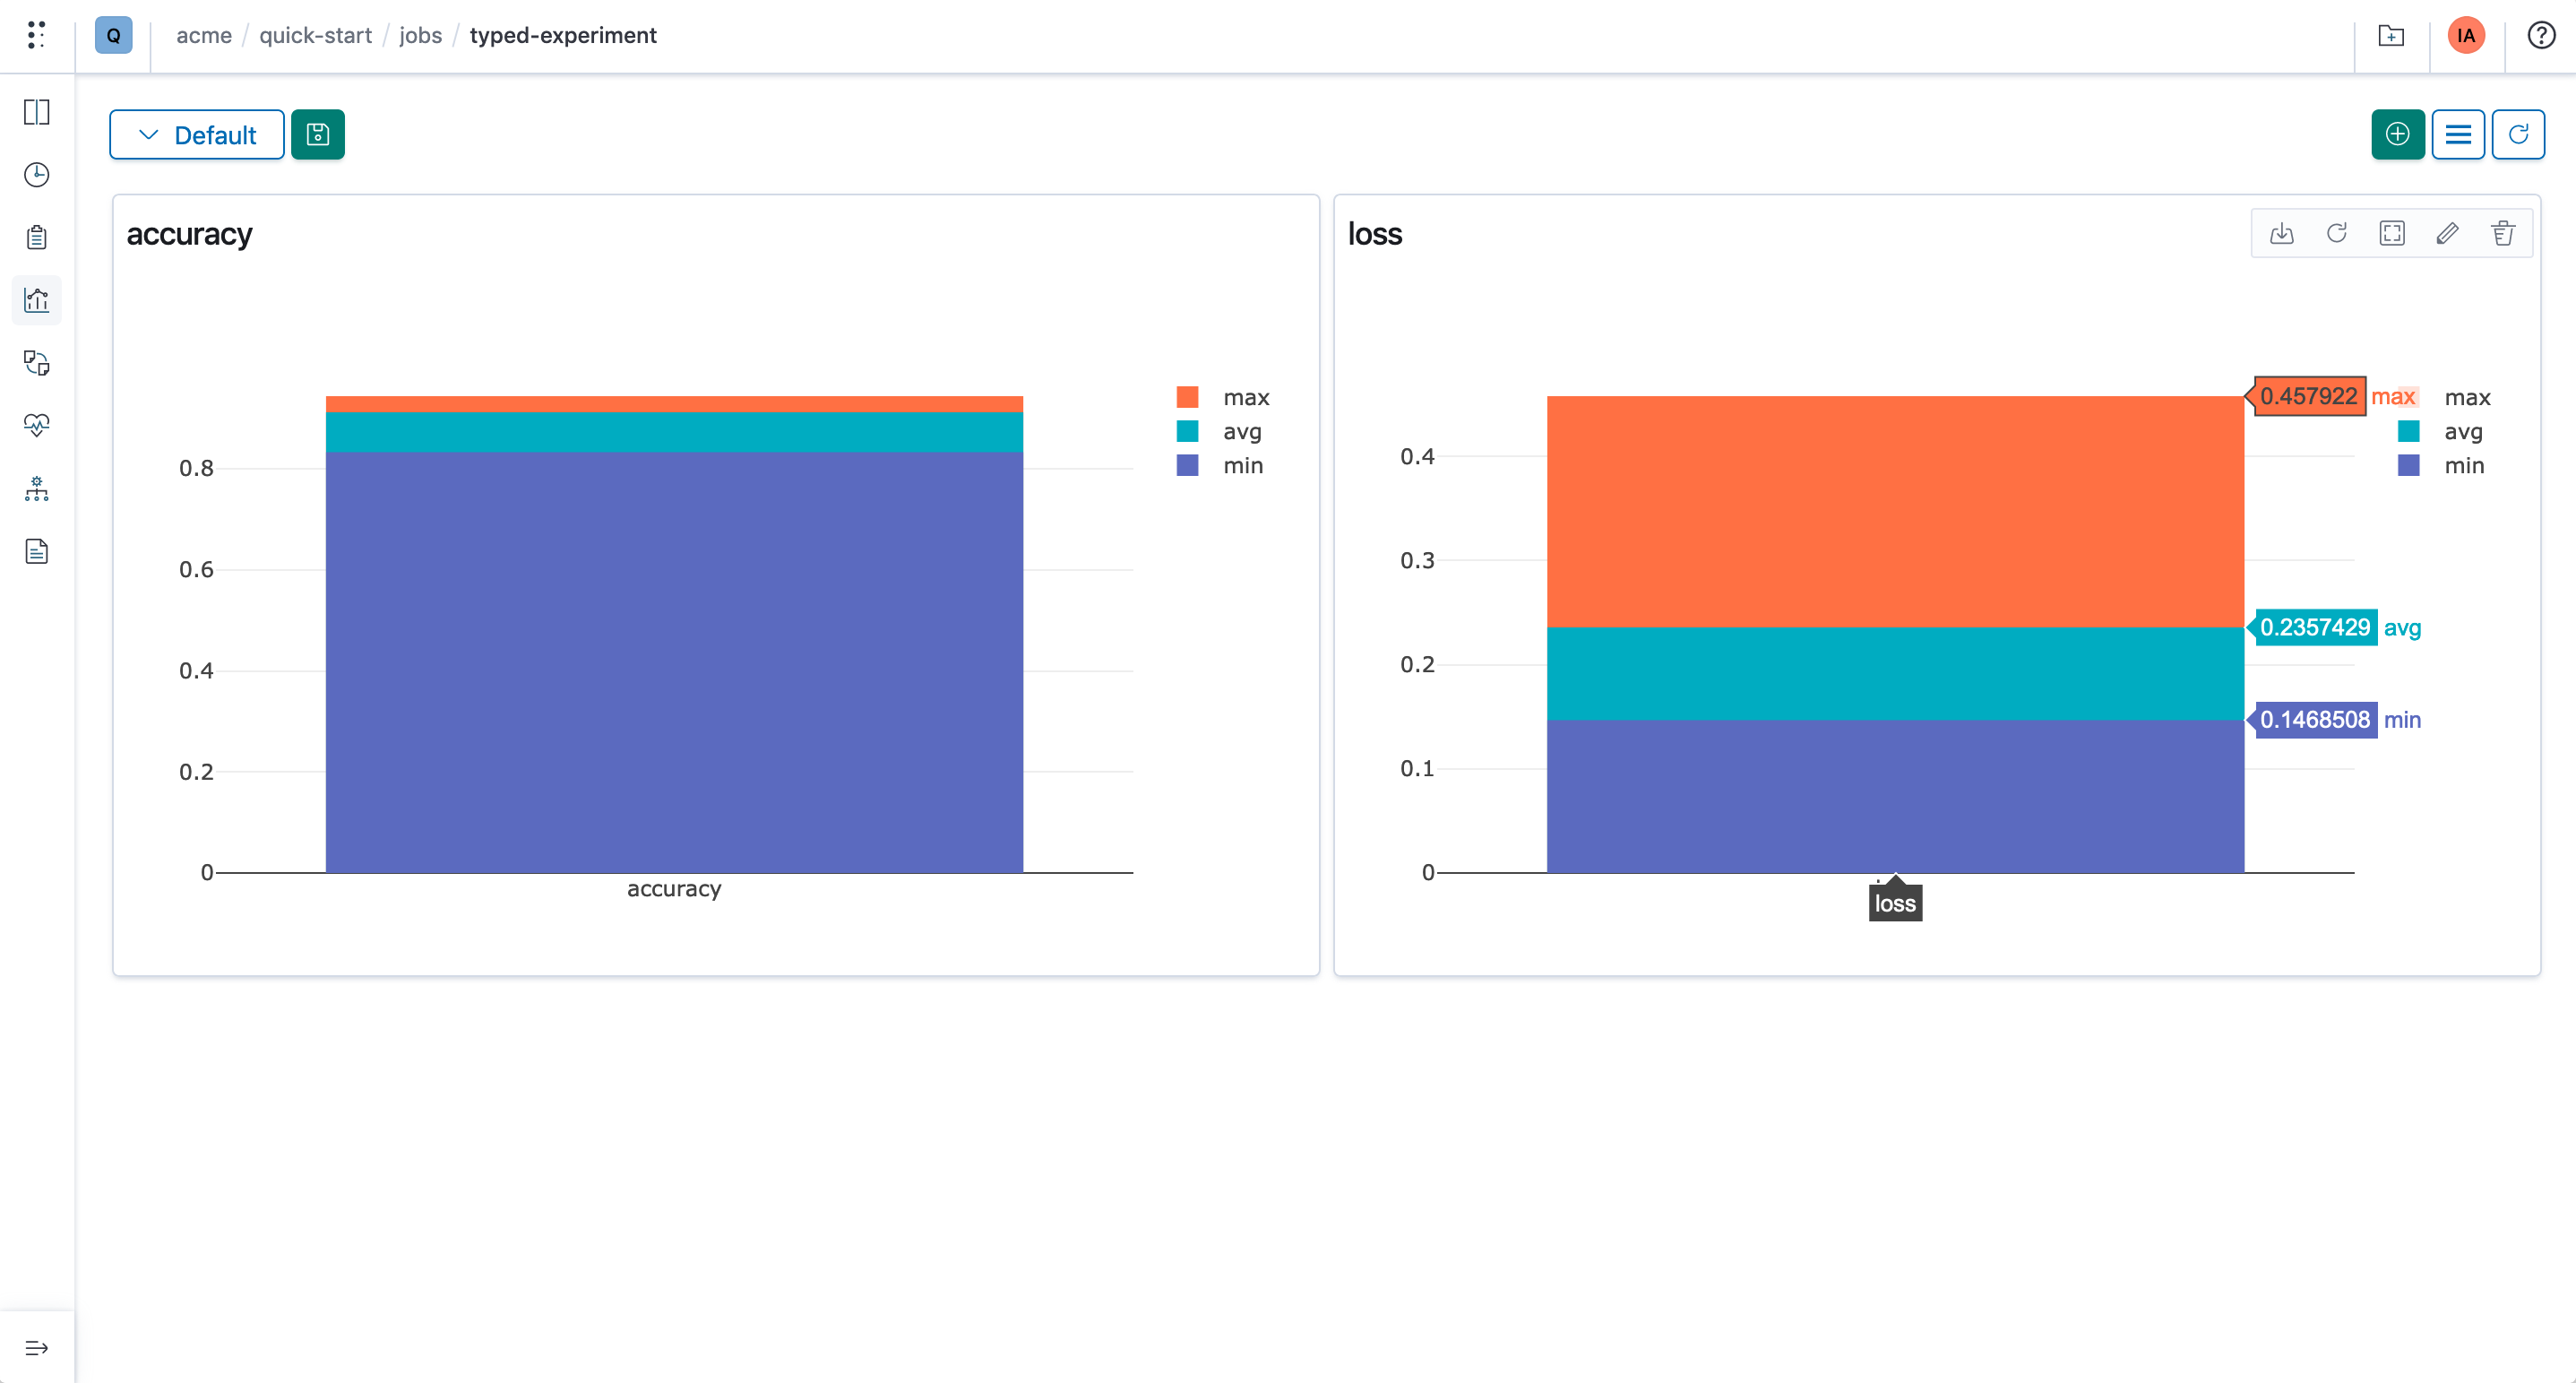
- Bar charts
- Stats charts
- Histogram charts
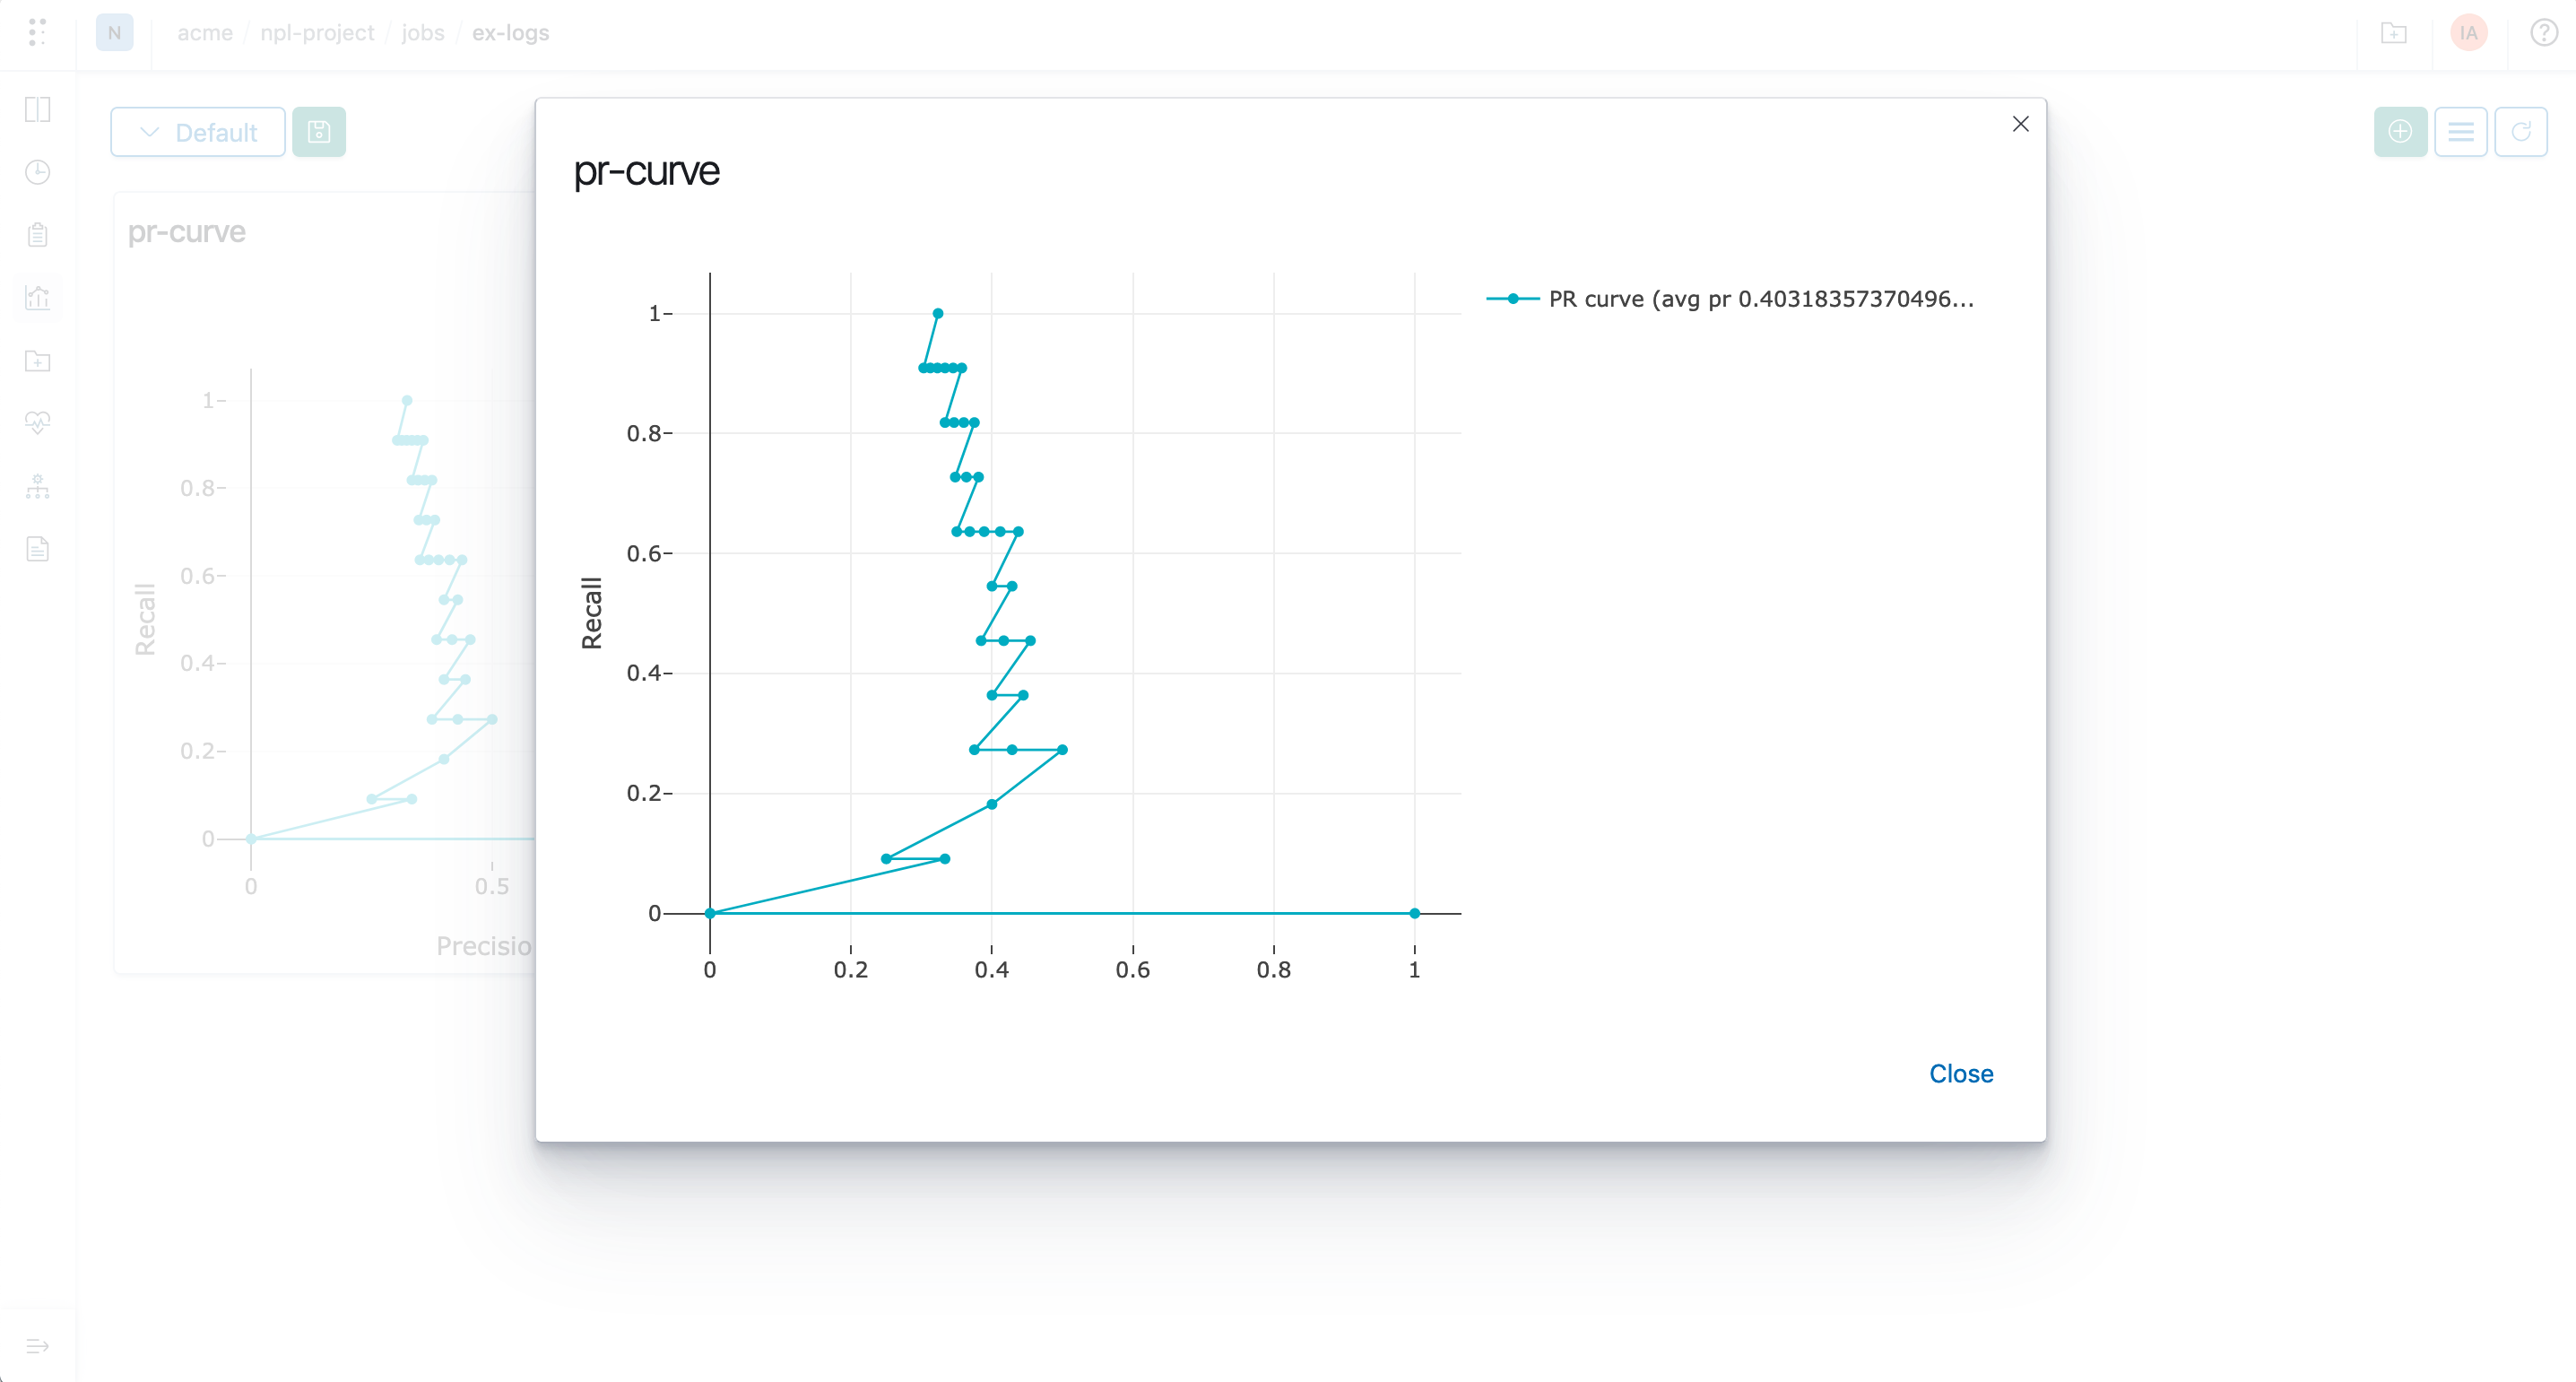
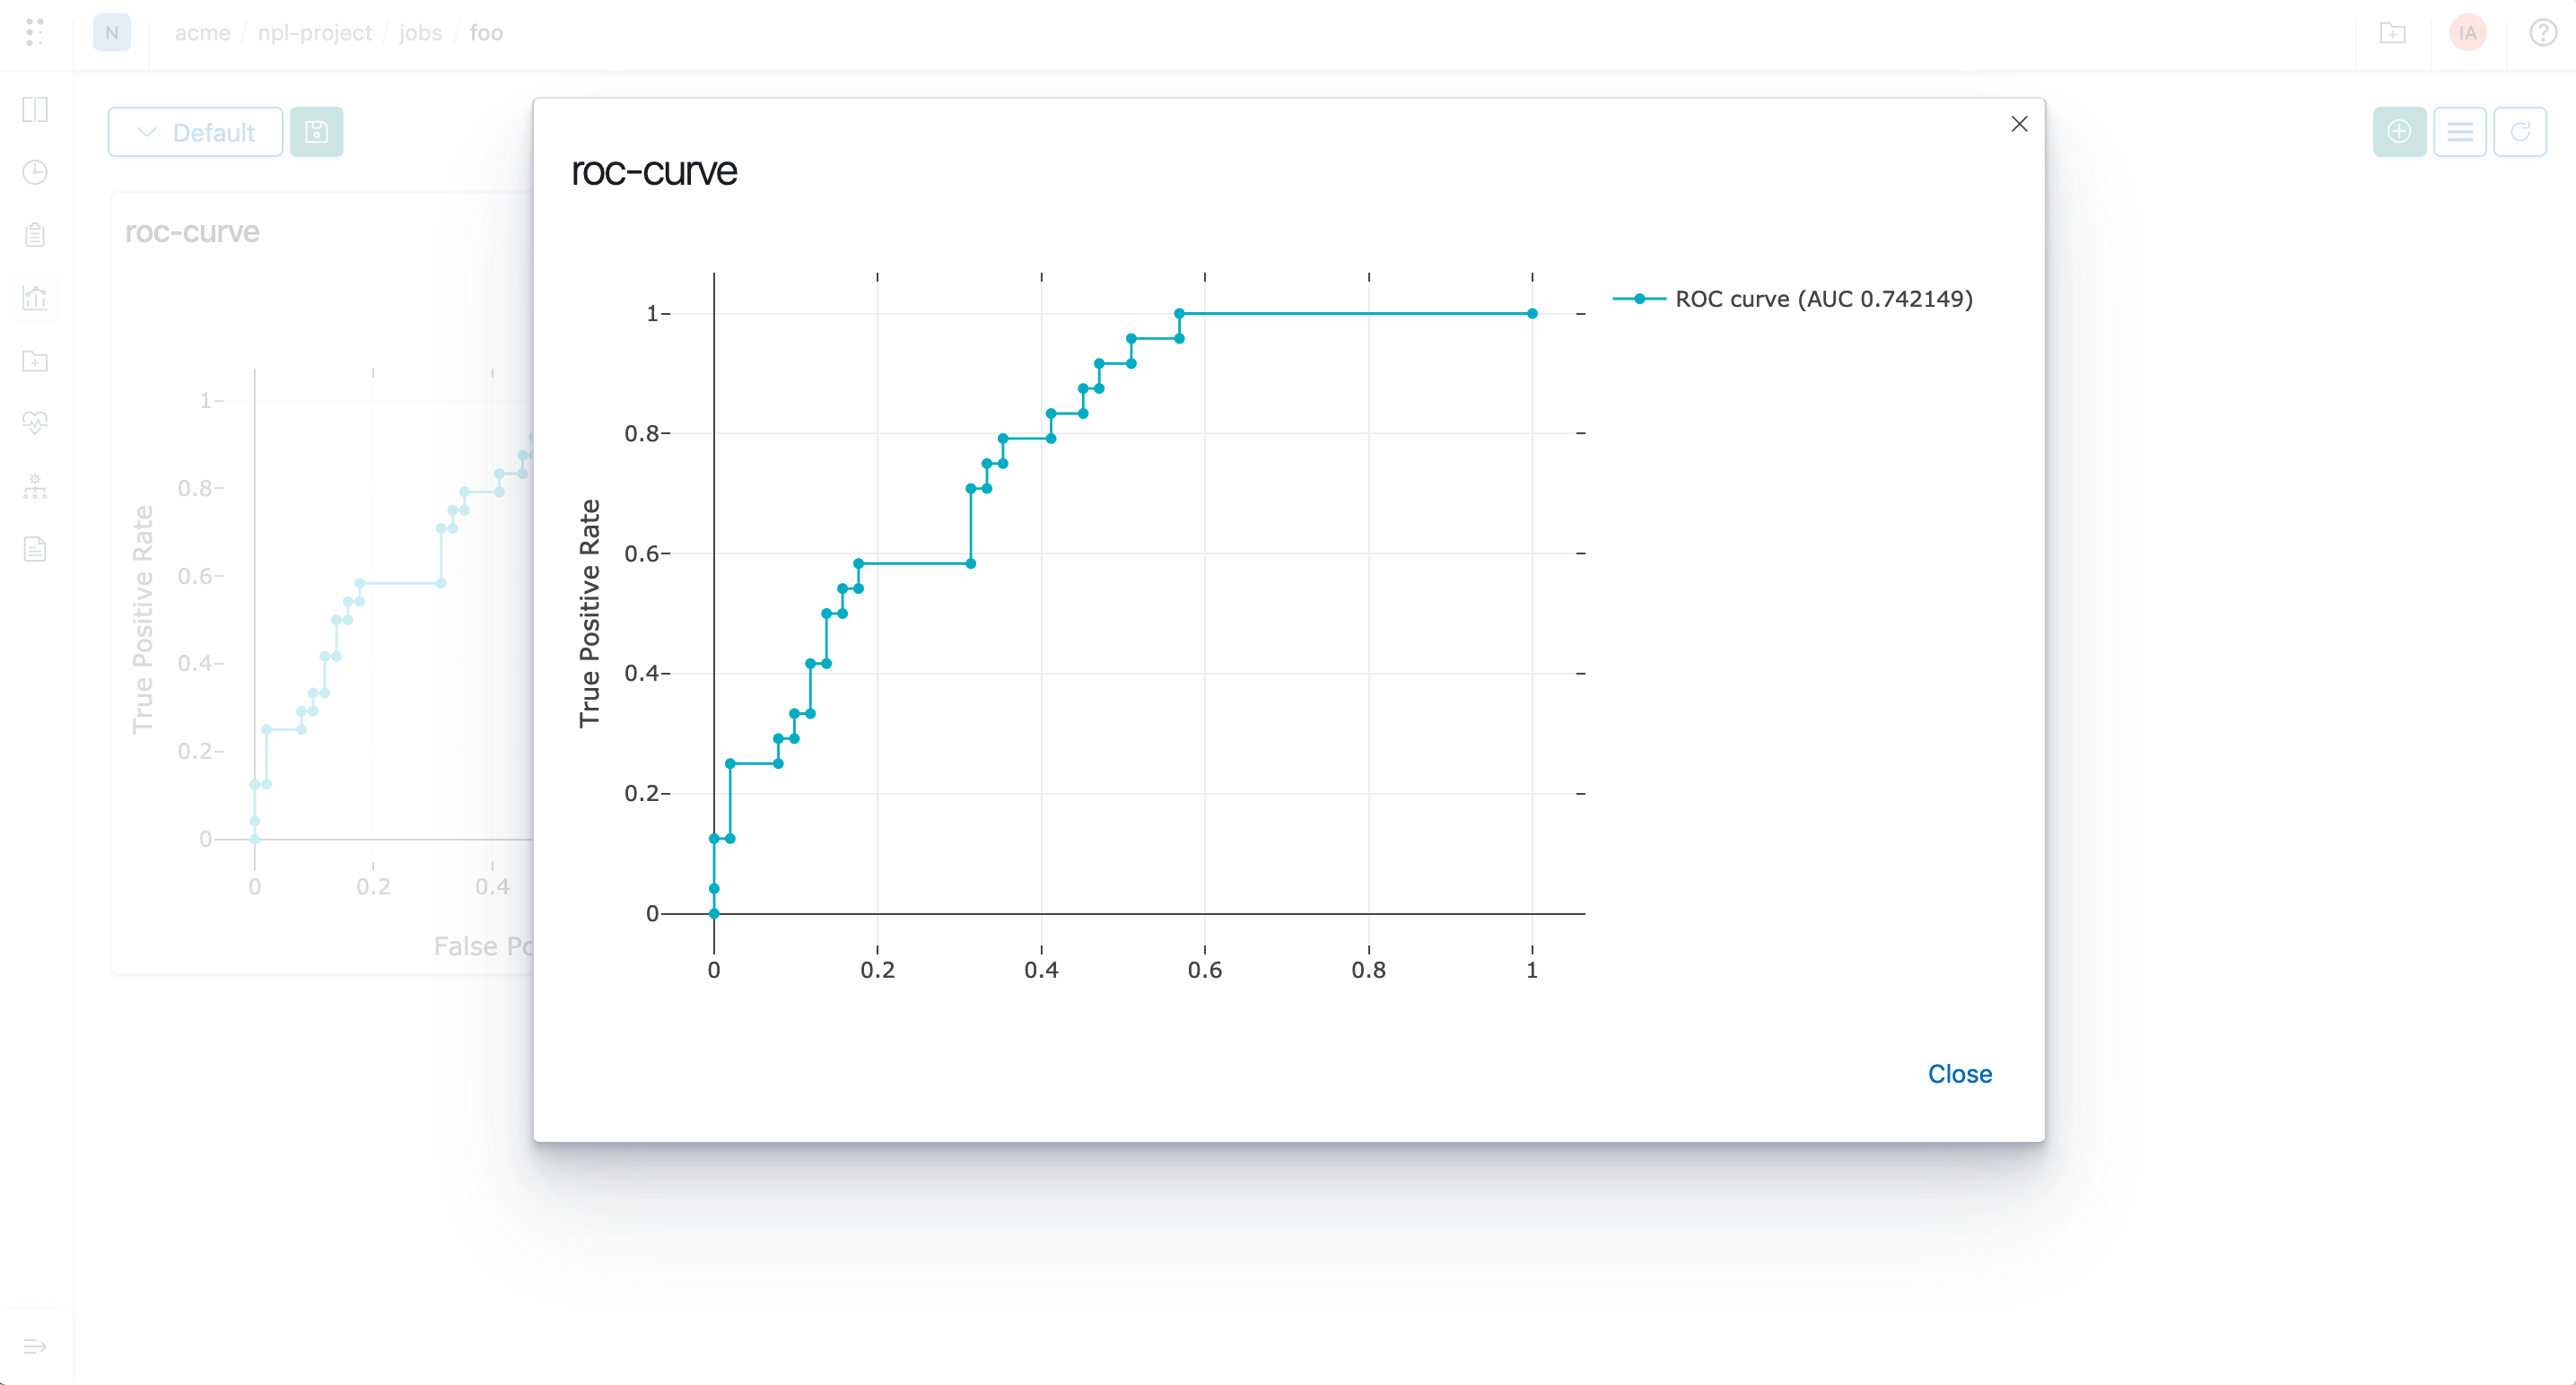
- Curve charts: PR curves, AUC/ROC curves, custom curves (
<x, y>arrays)
Multi-run
For multi-run you can compare metrics and curves from several runs, as well as charts for hyperparameter values and metrics:
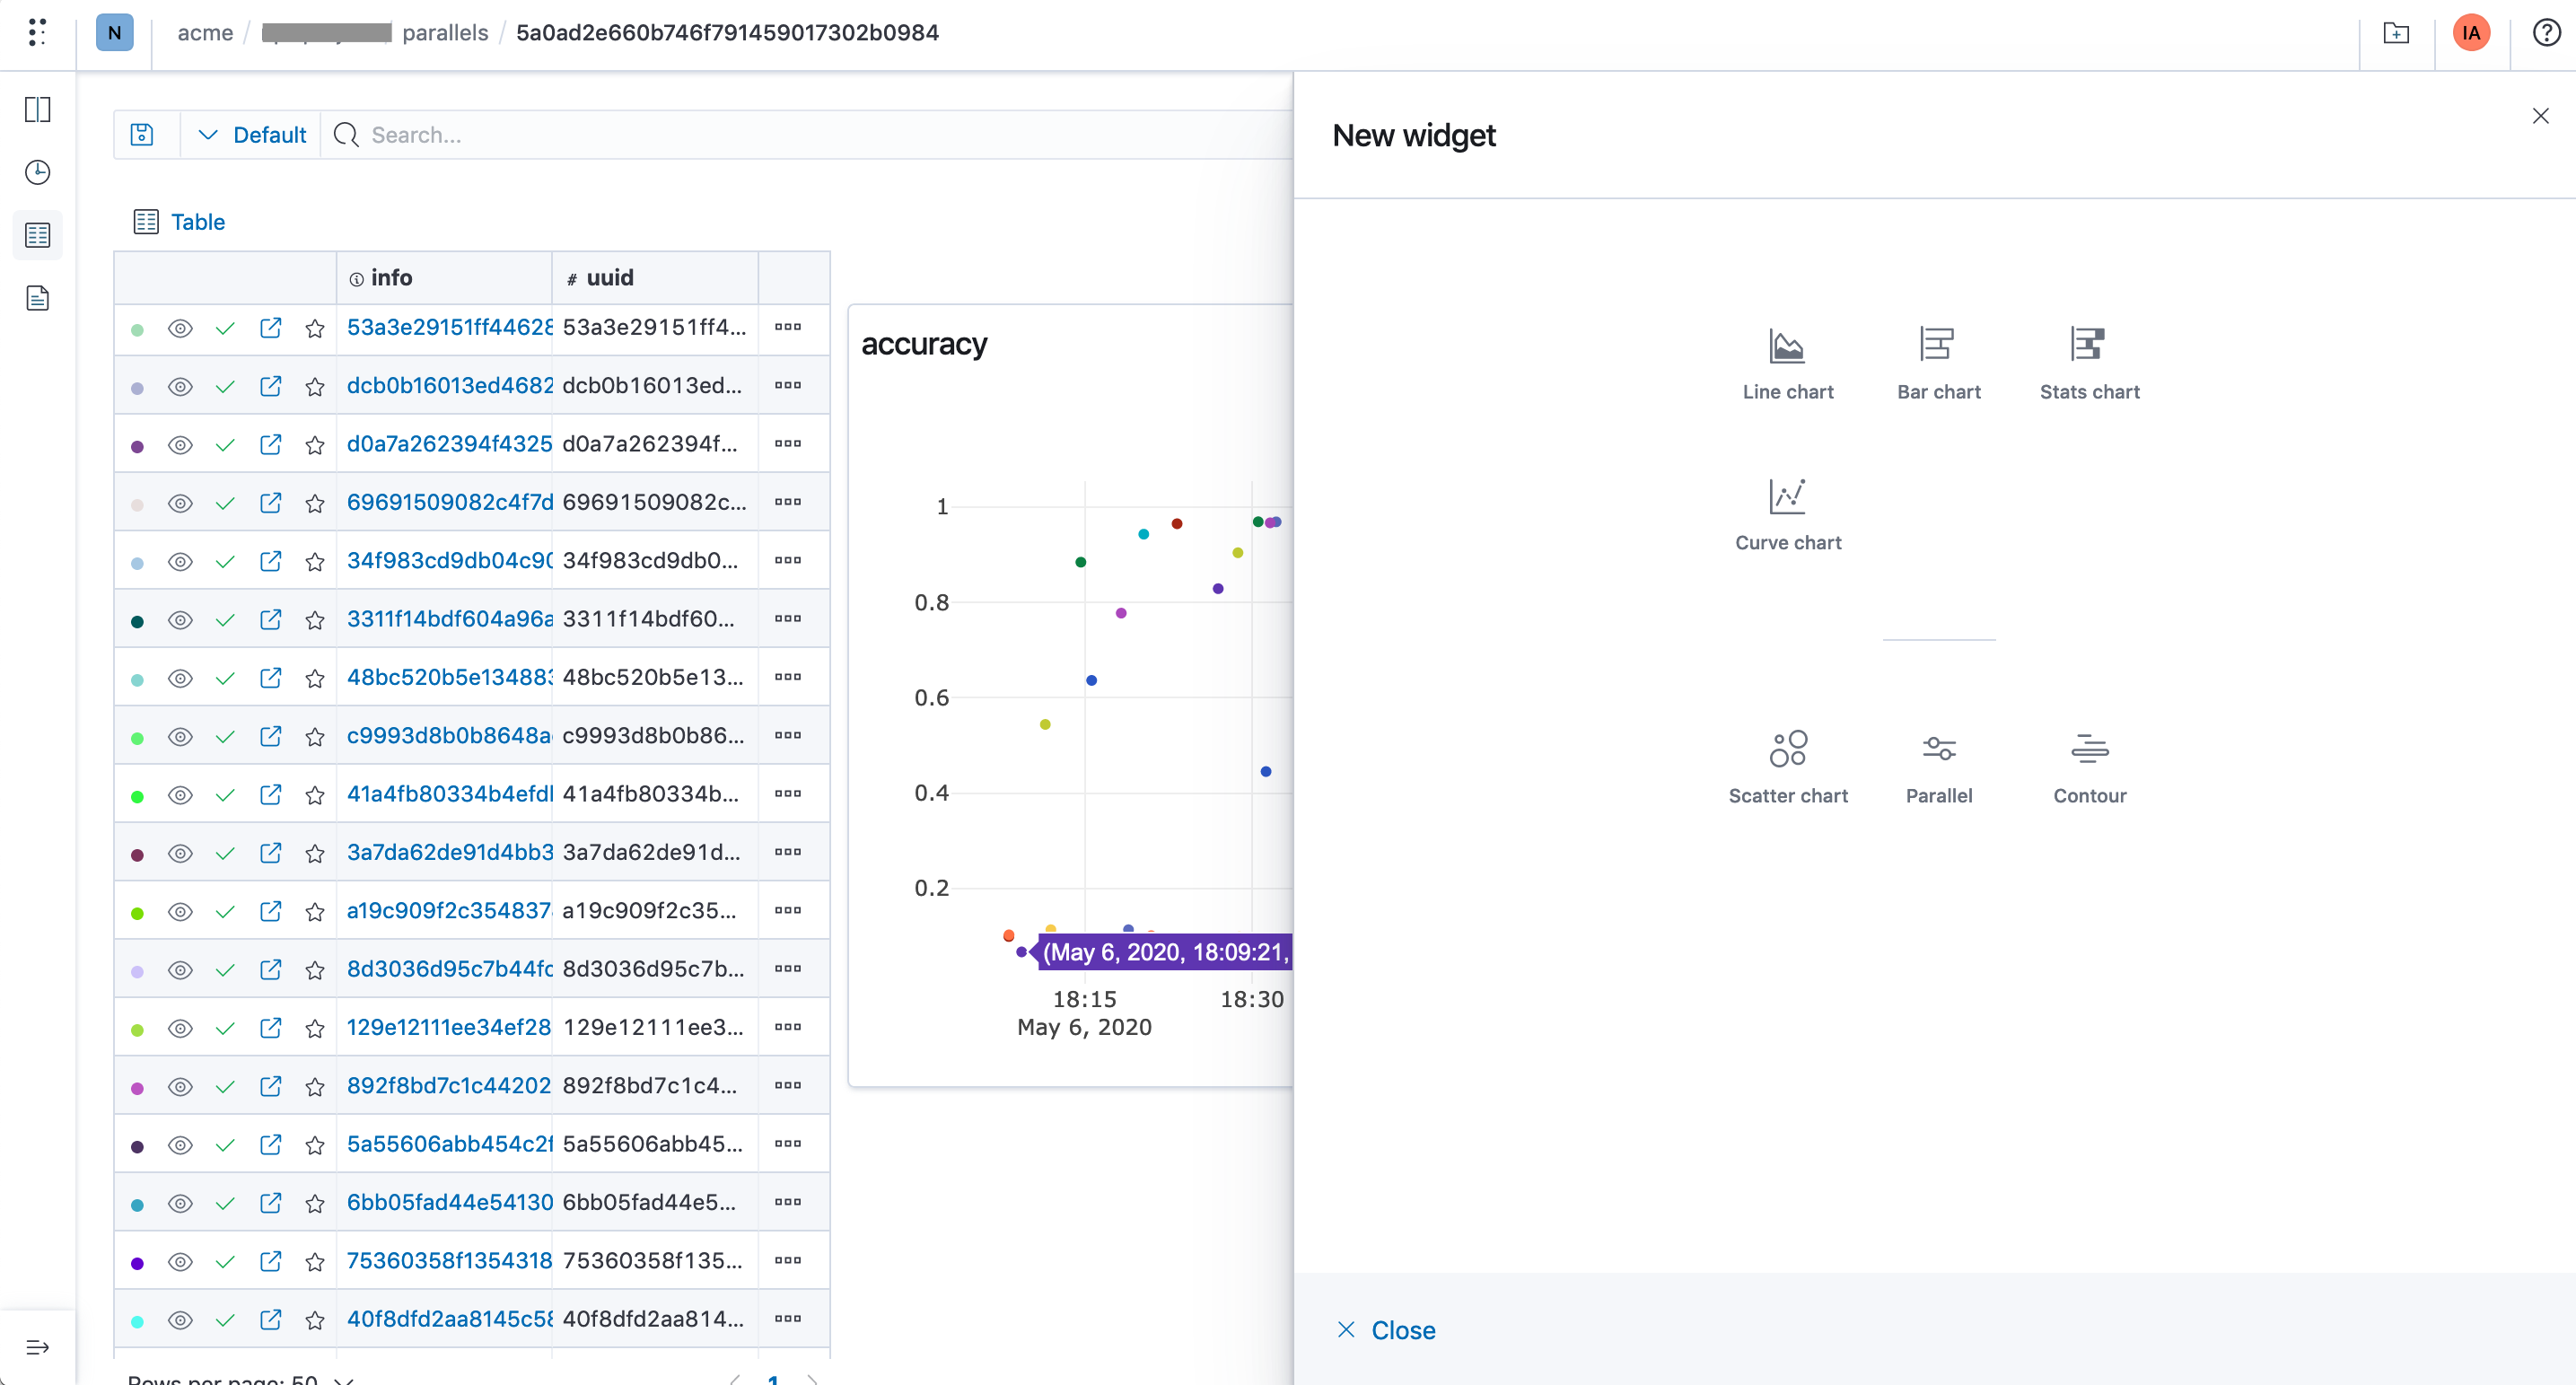
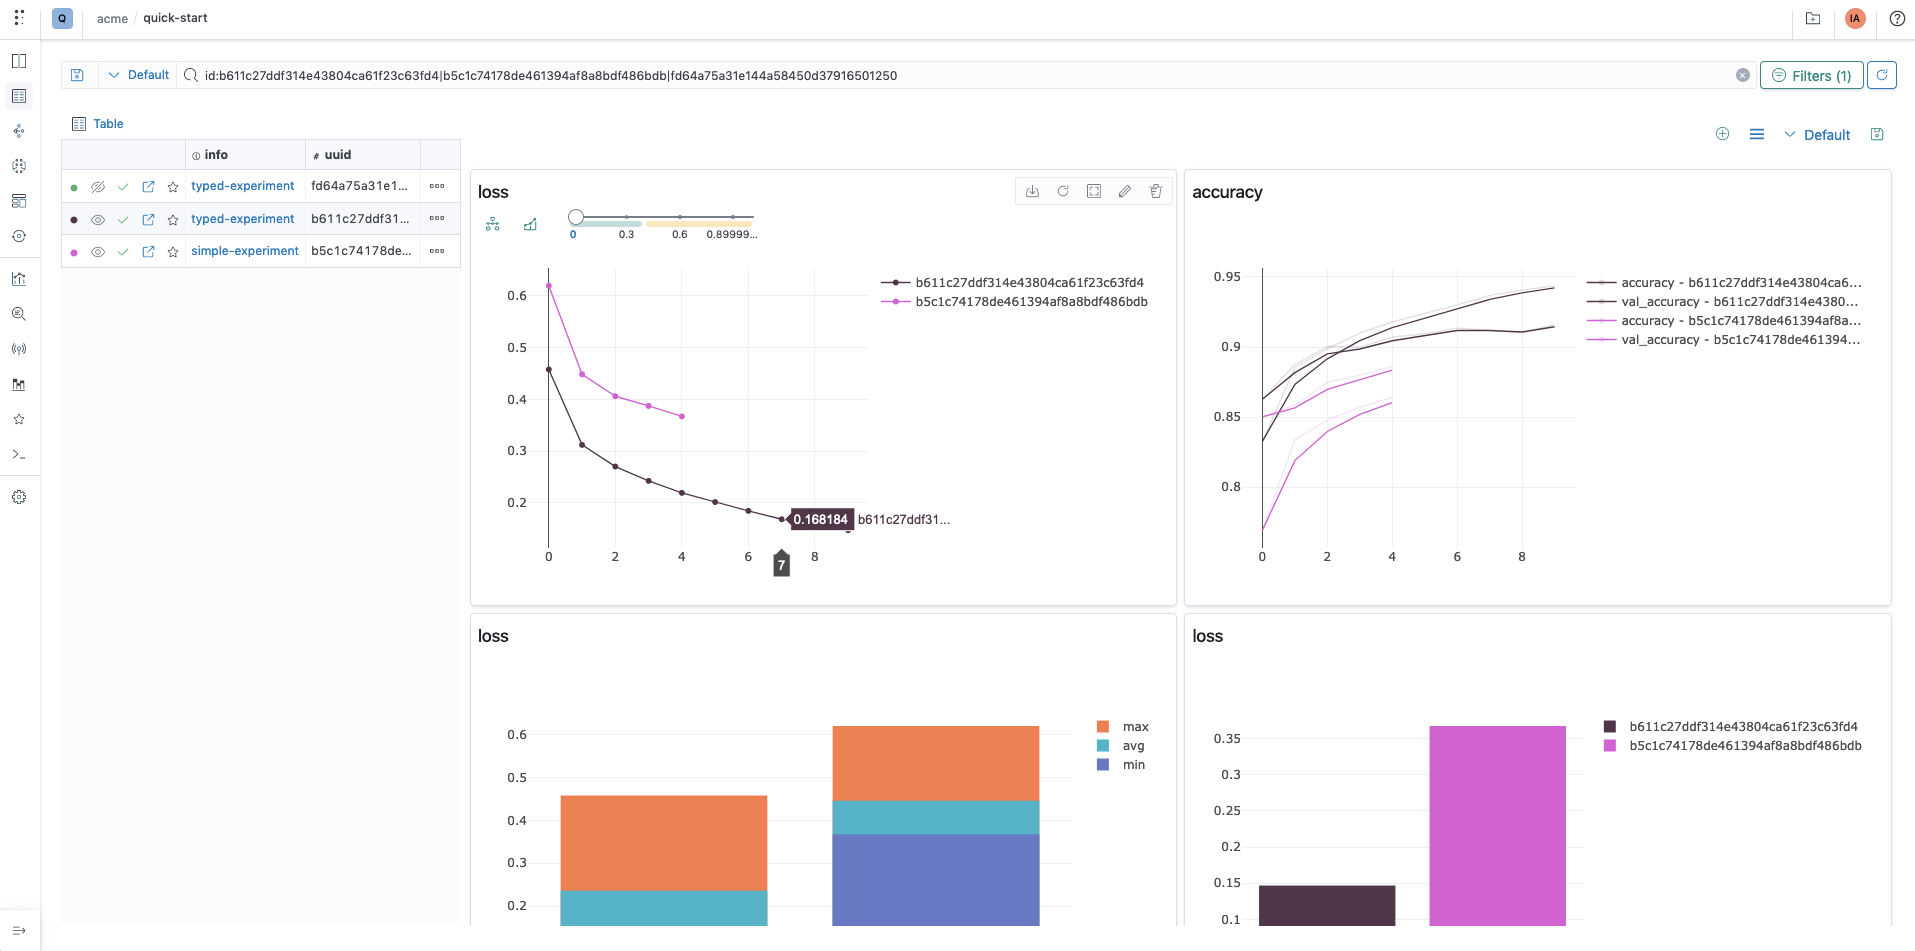
- Line charts
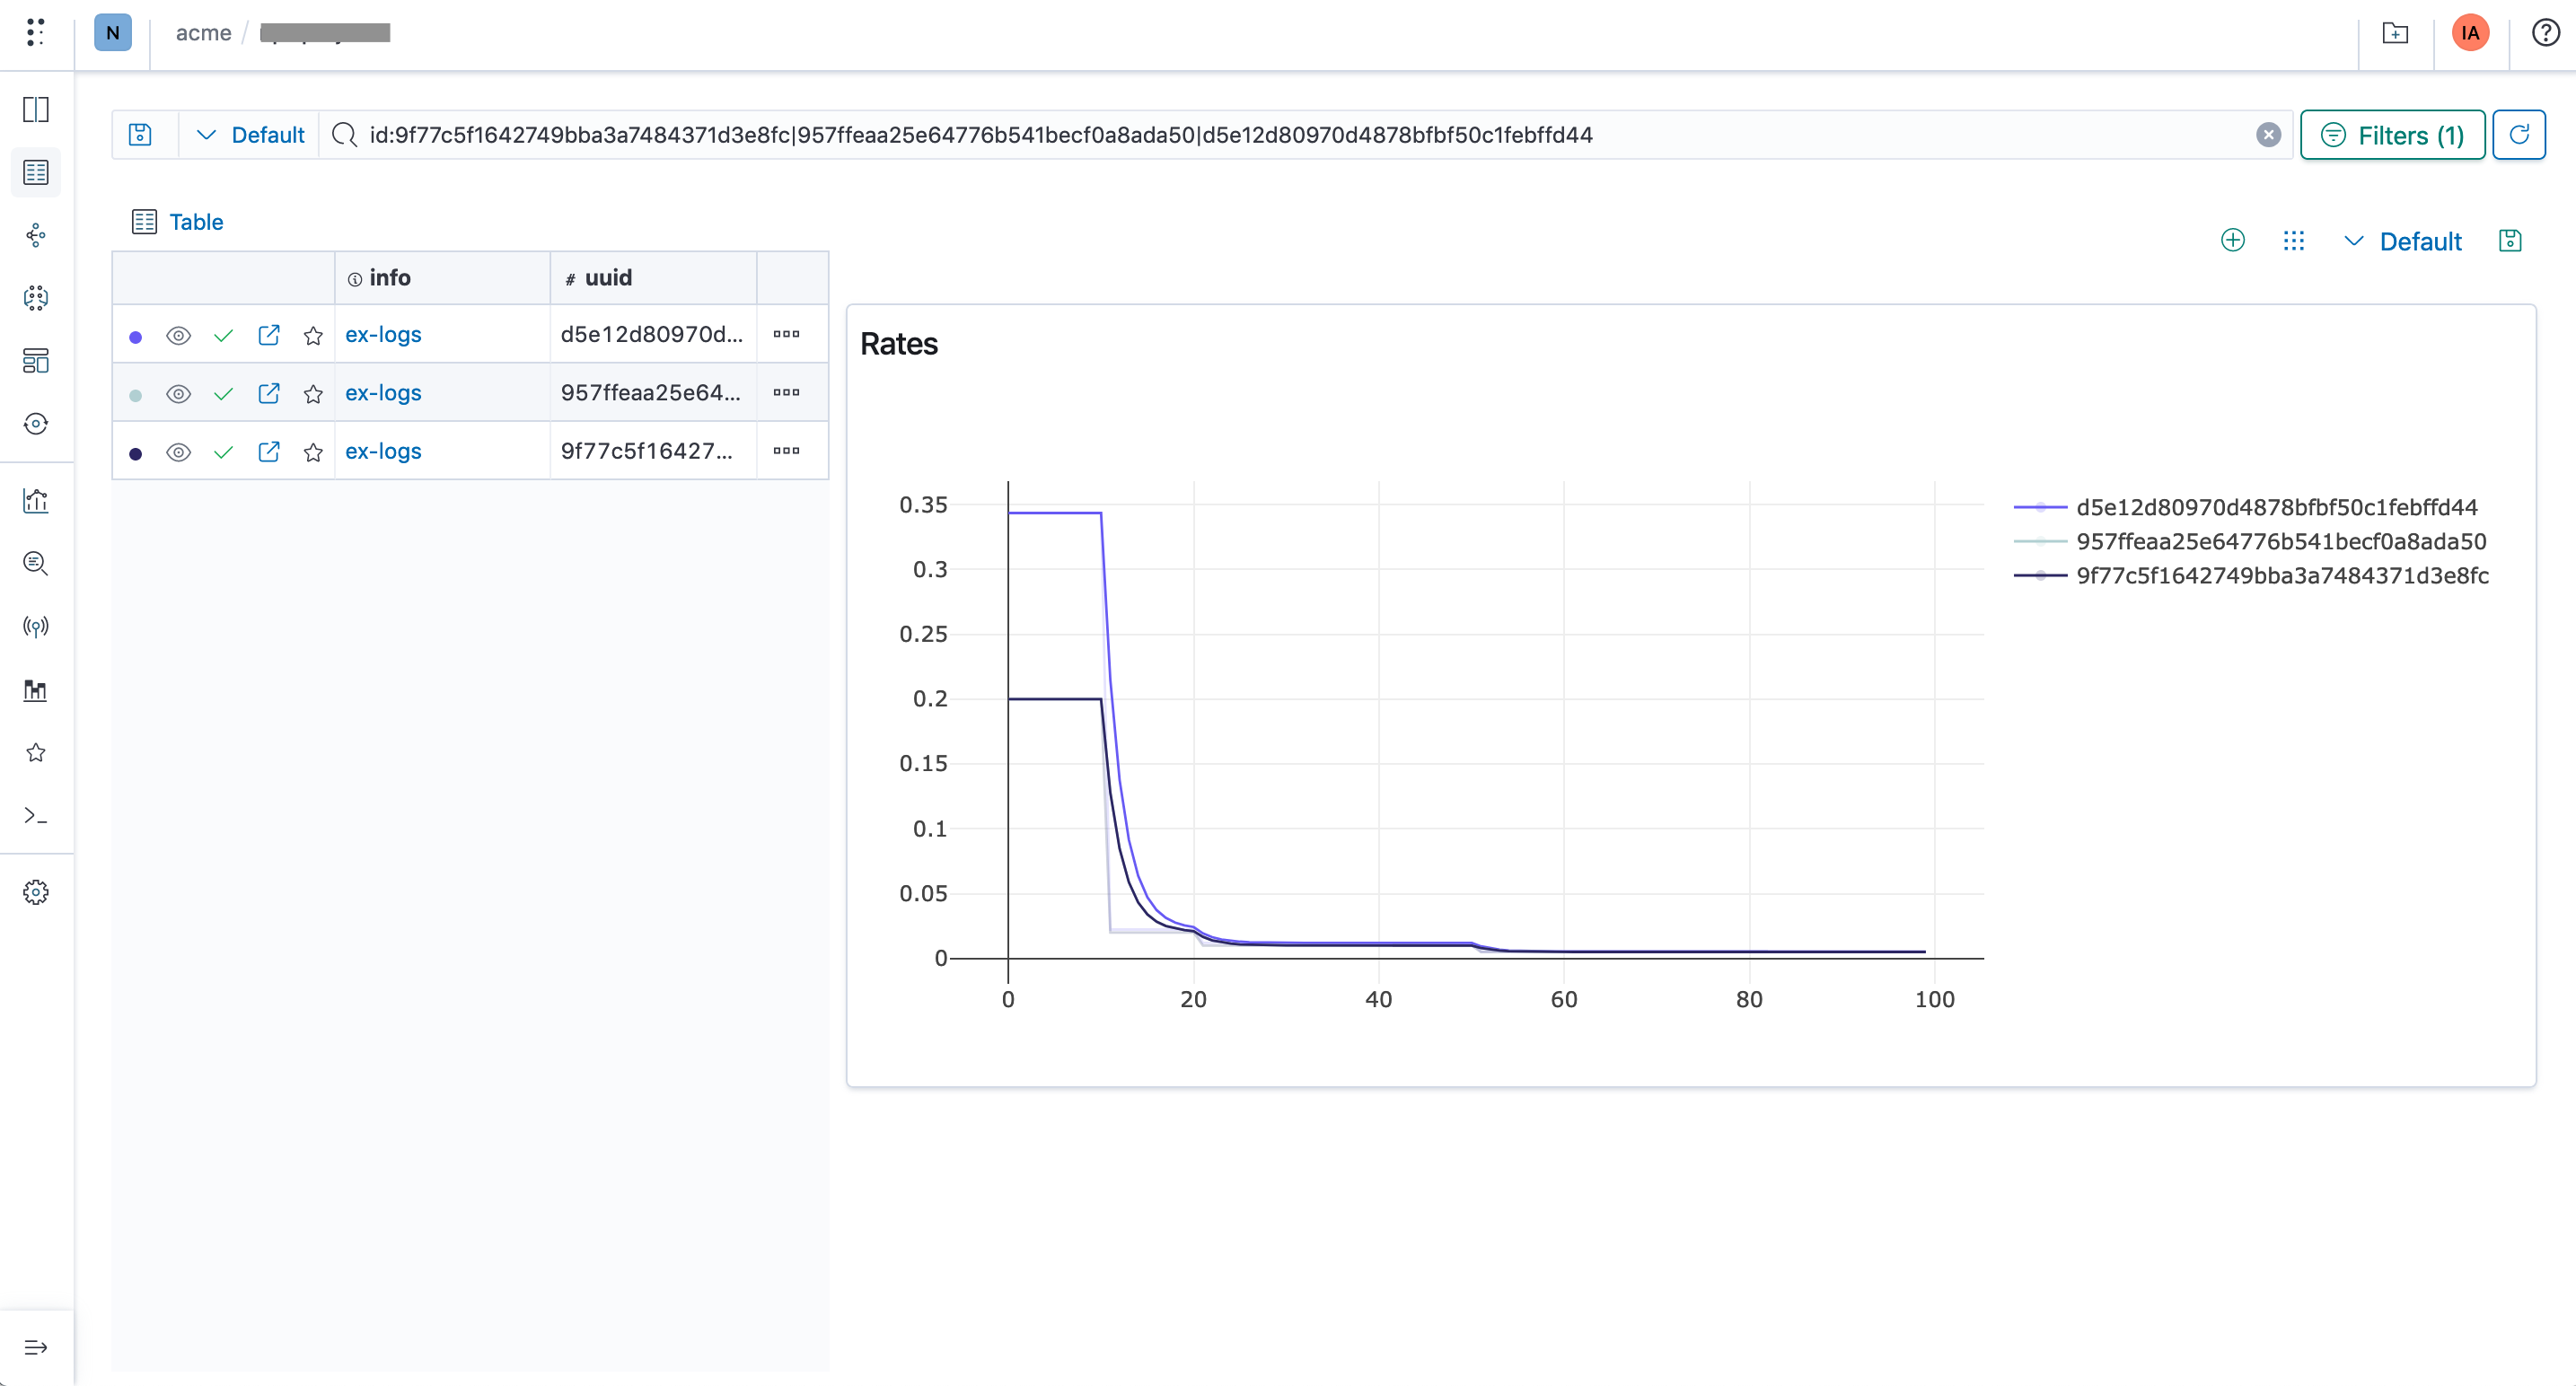
- Bar charts
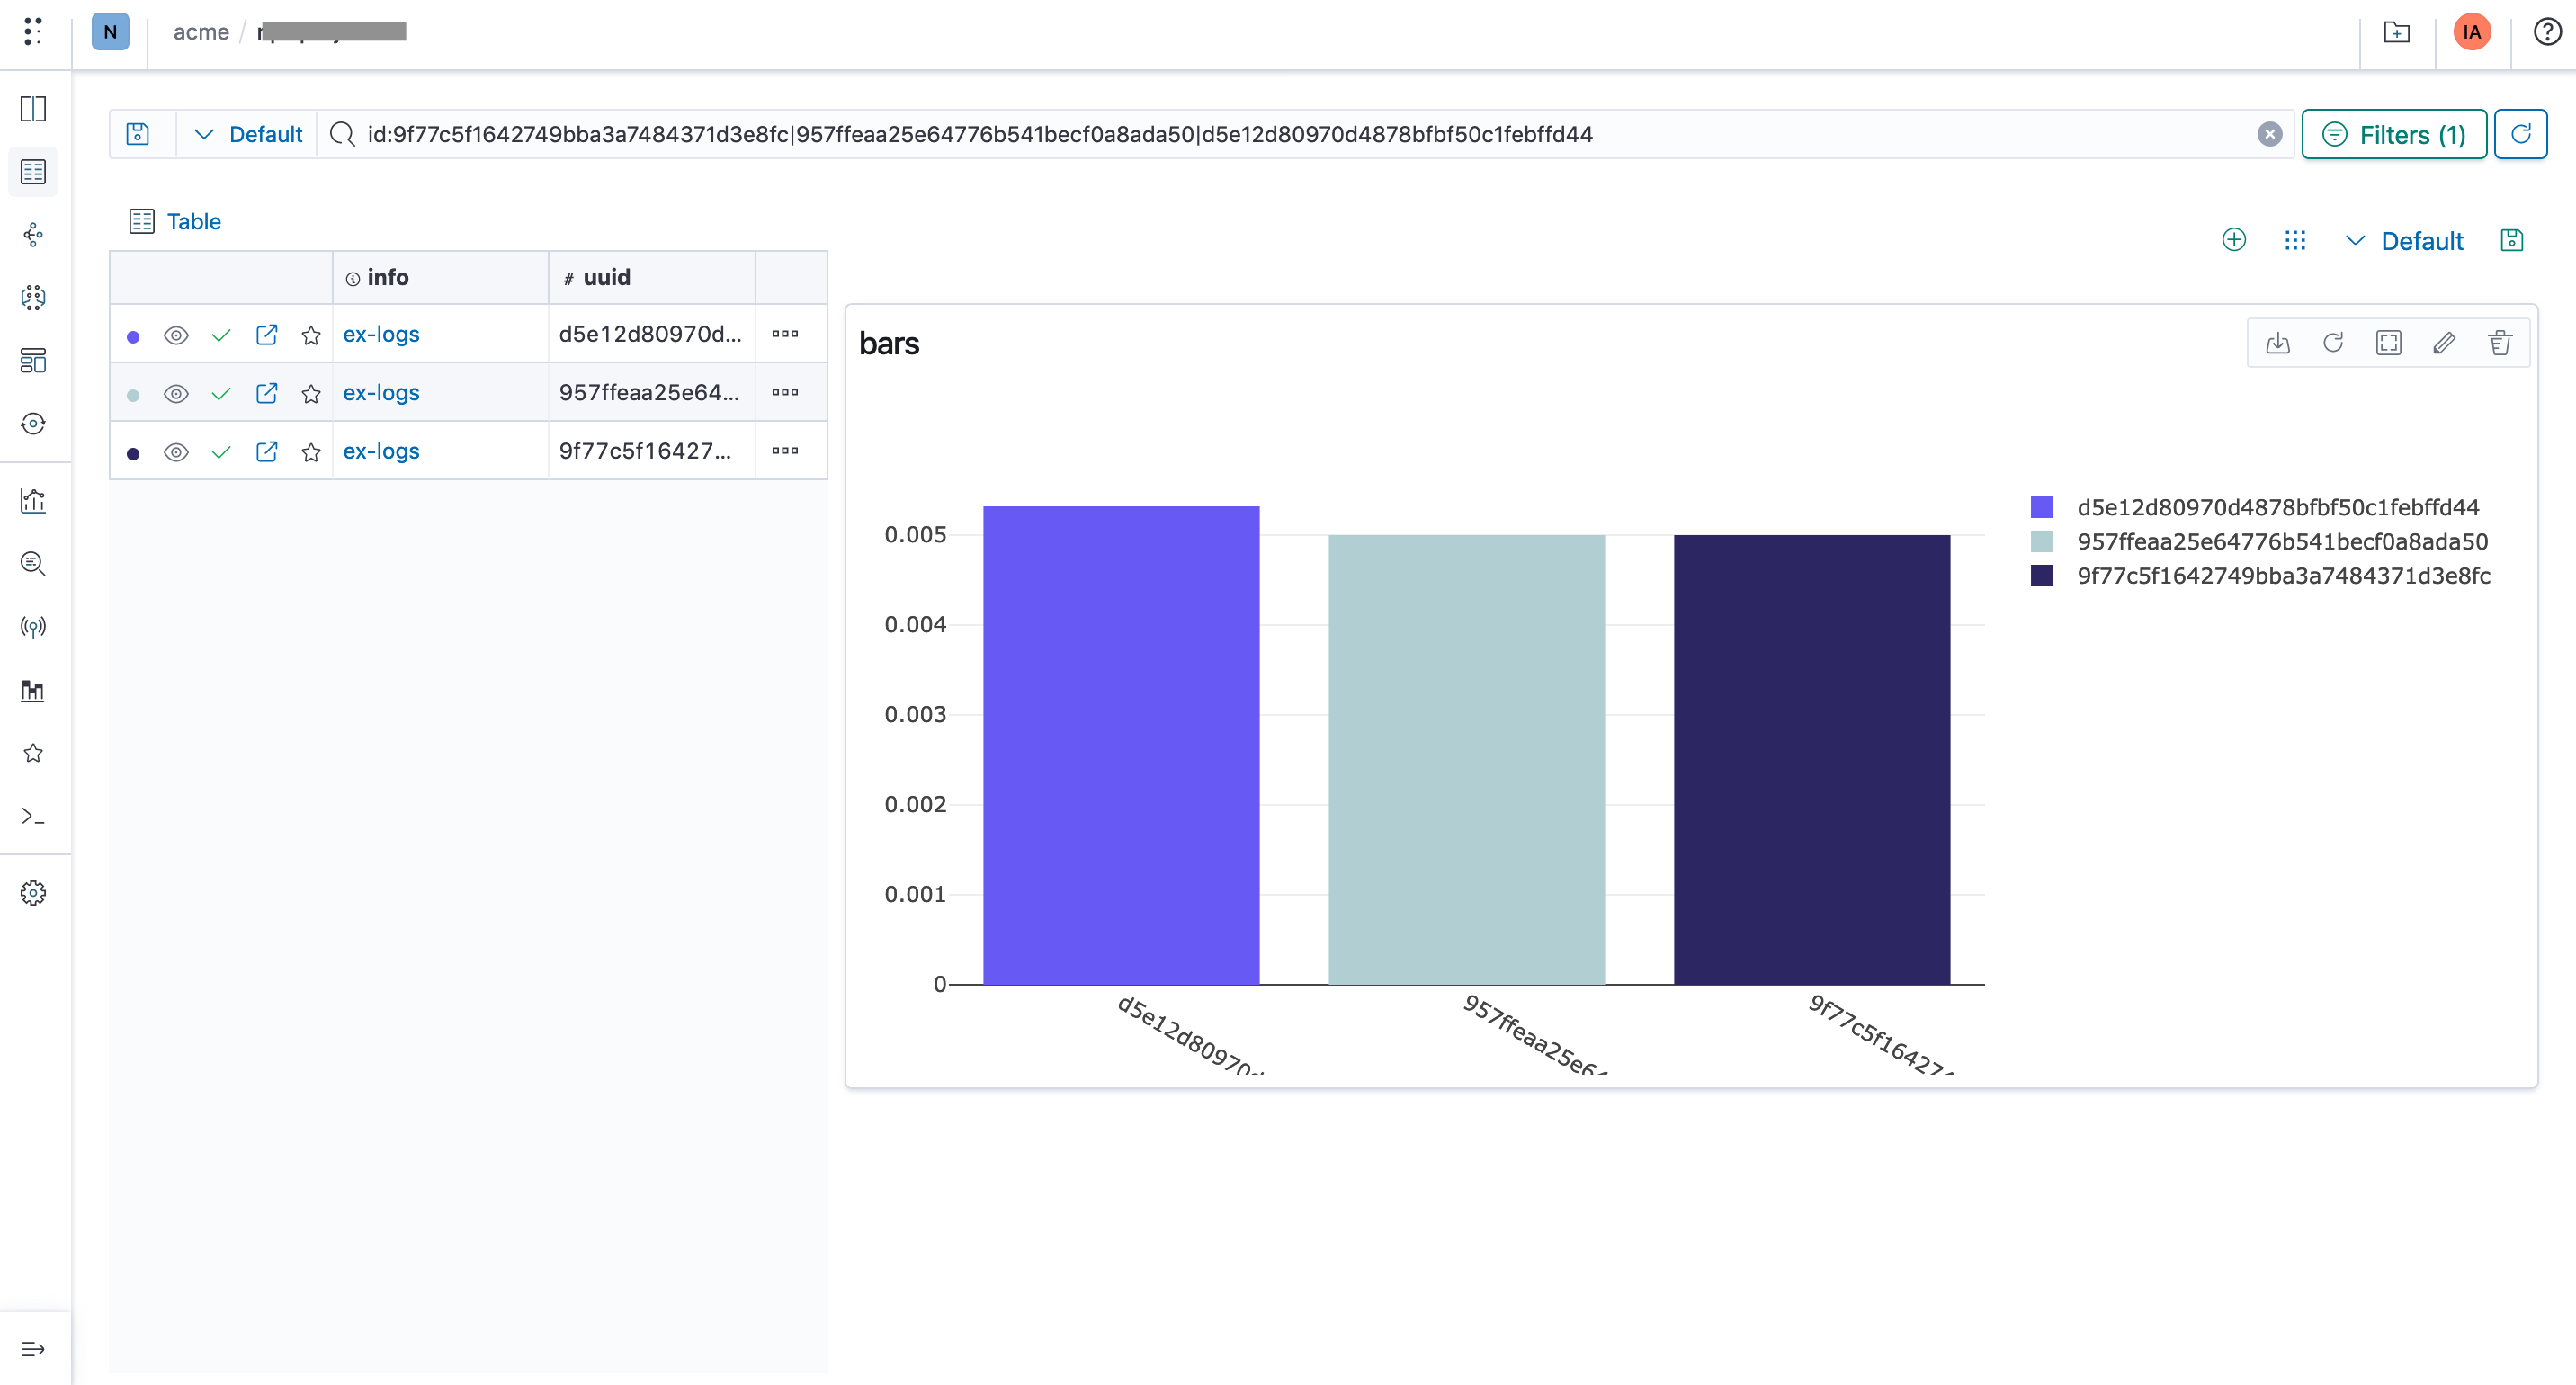
- Stats charts
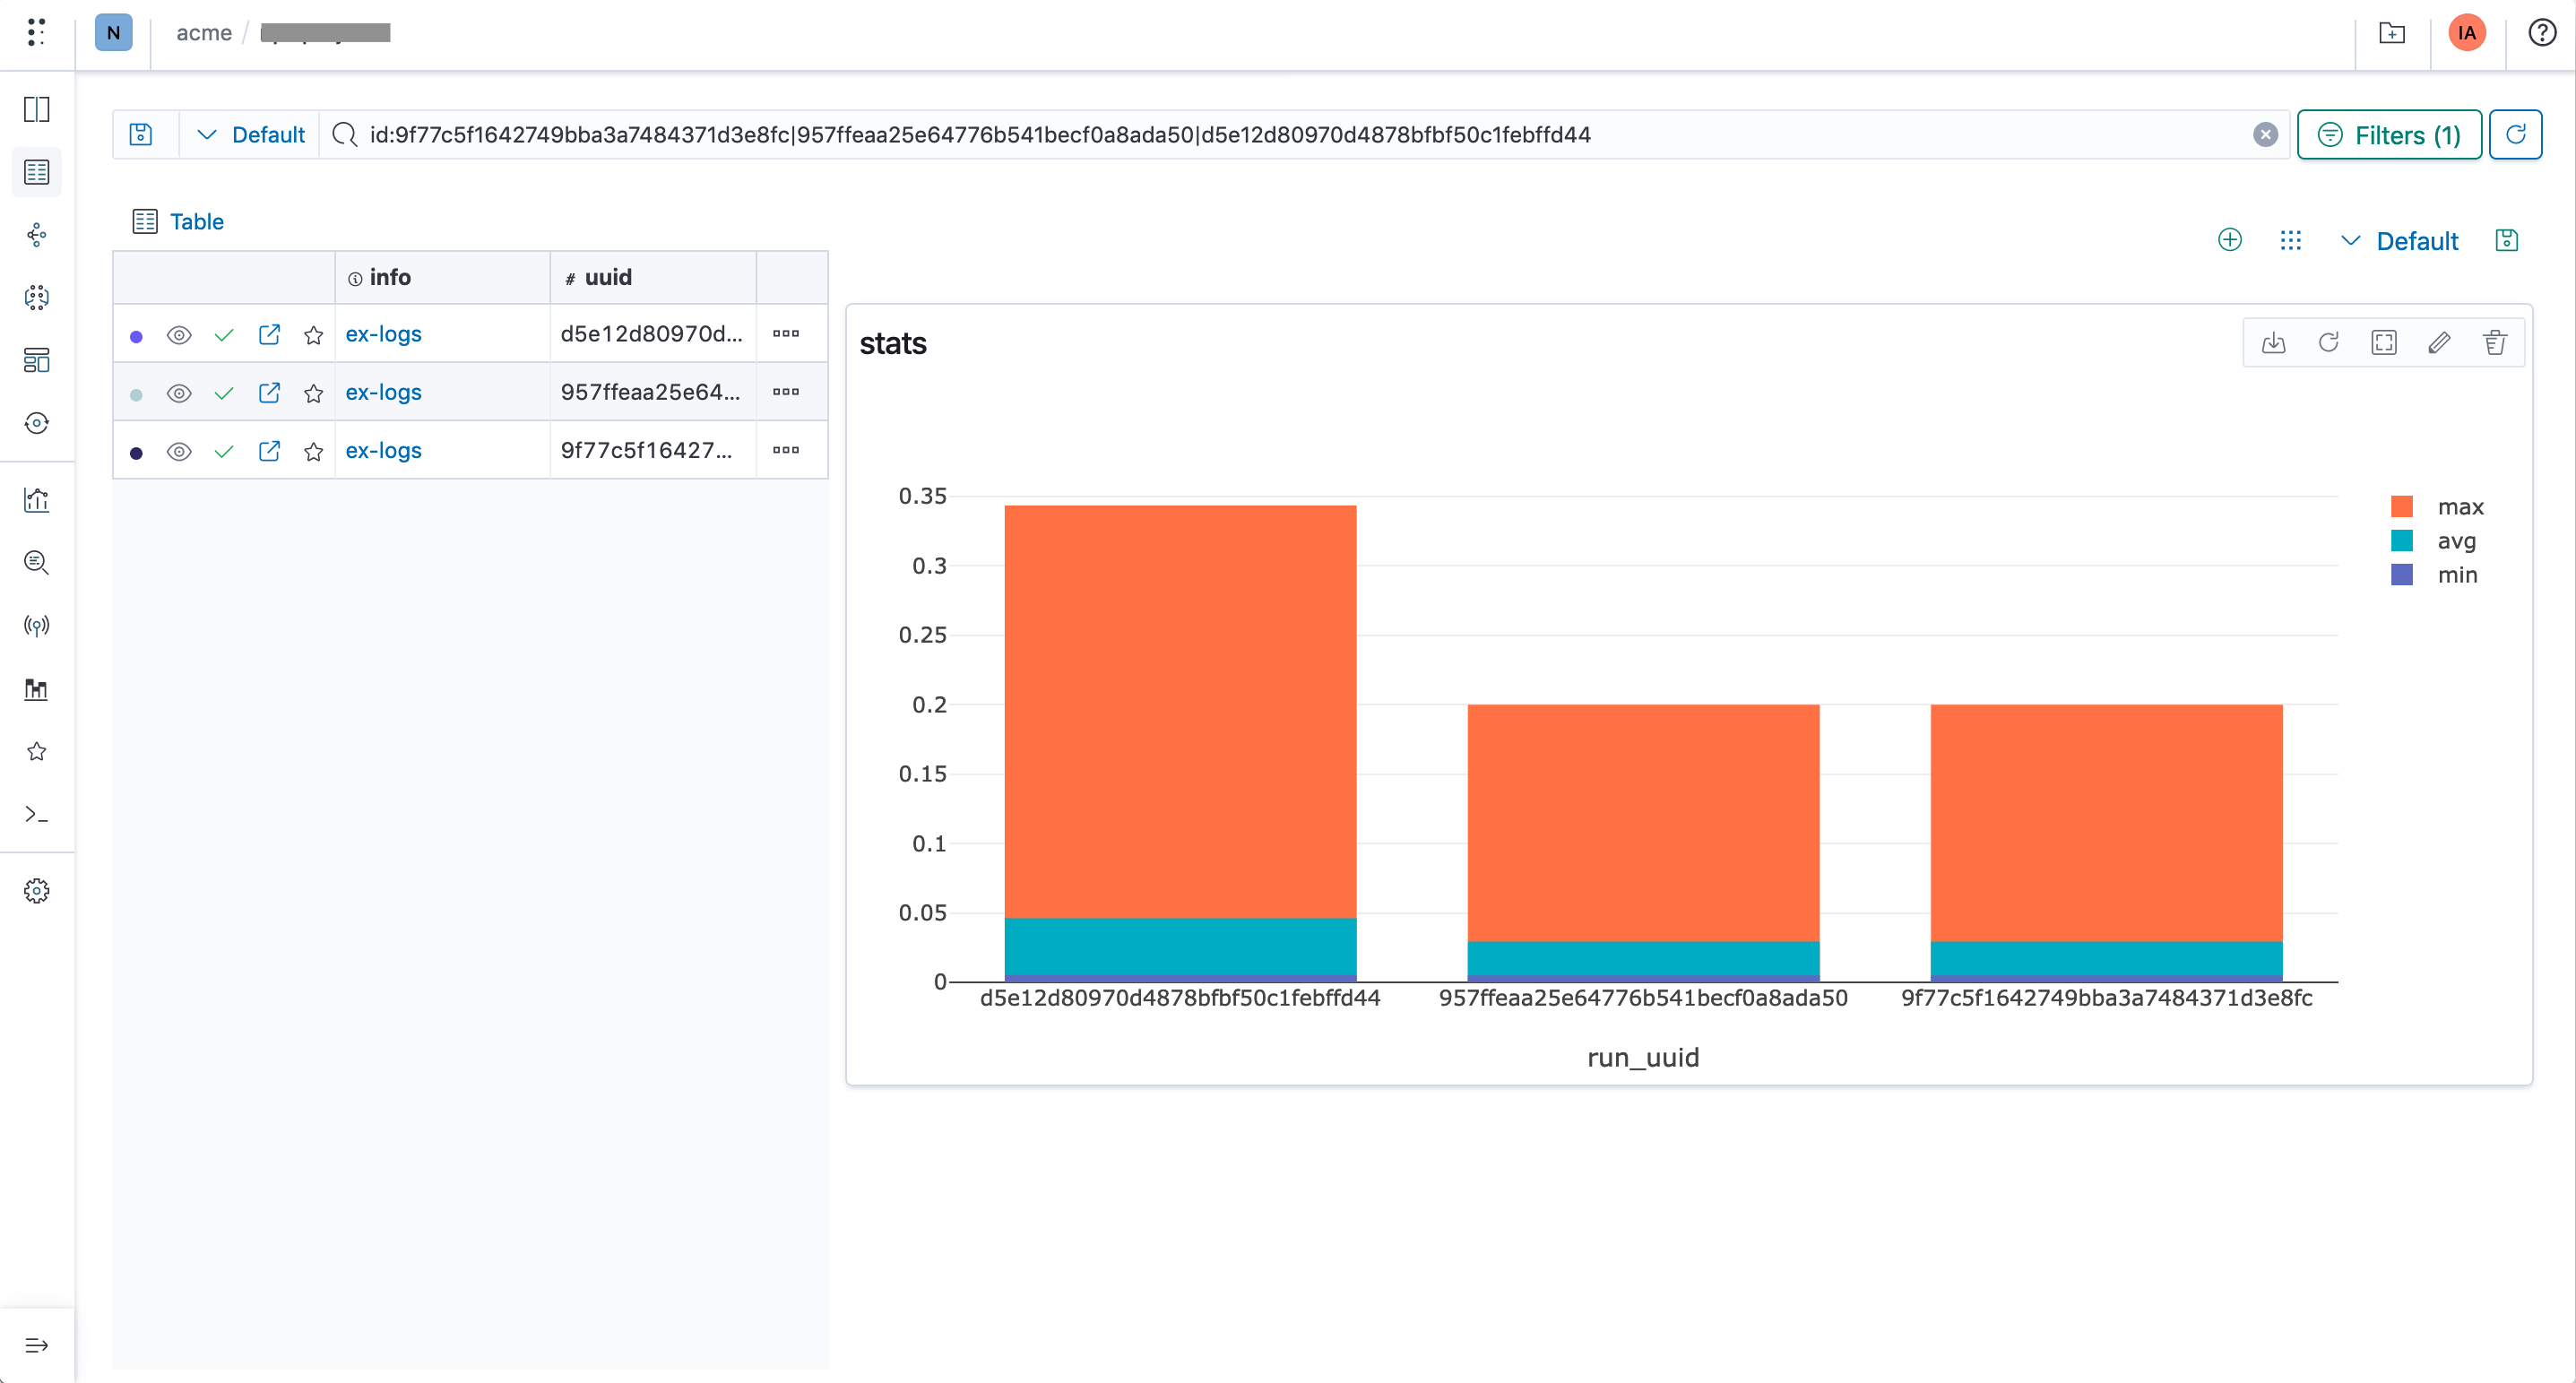
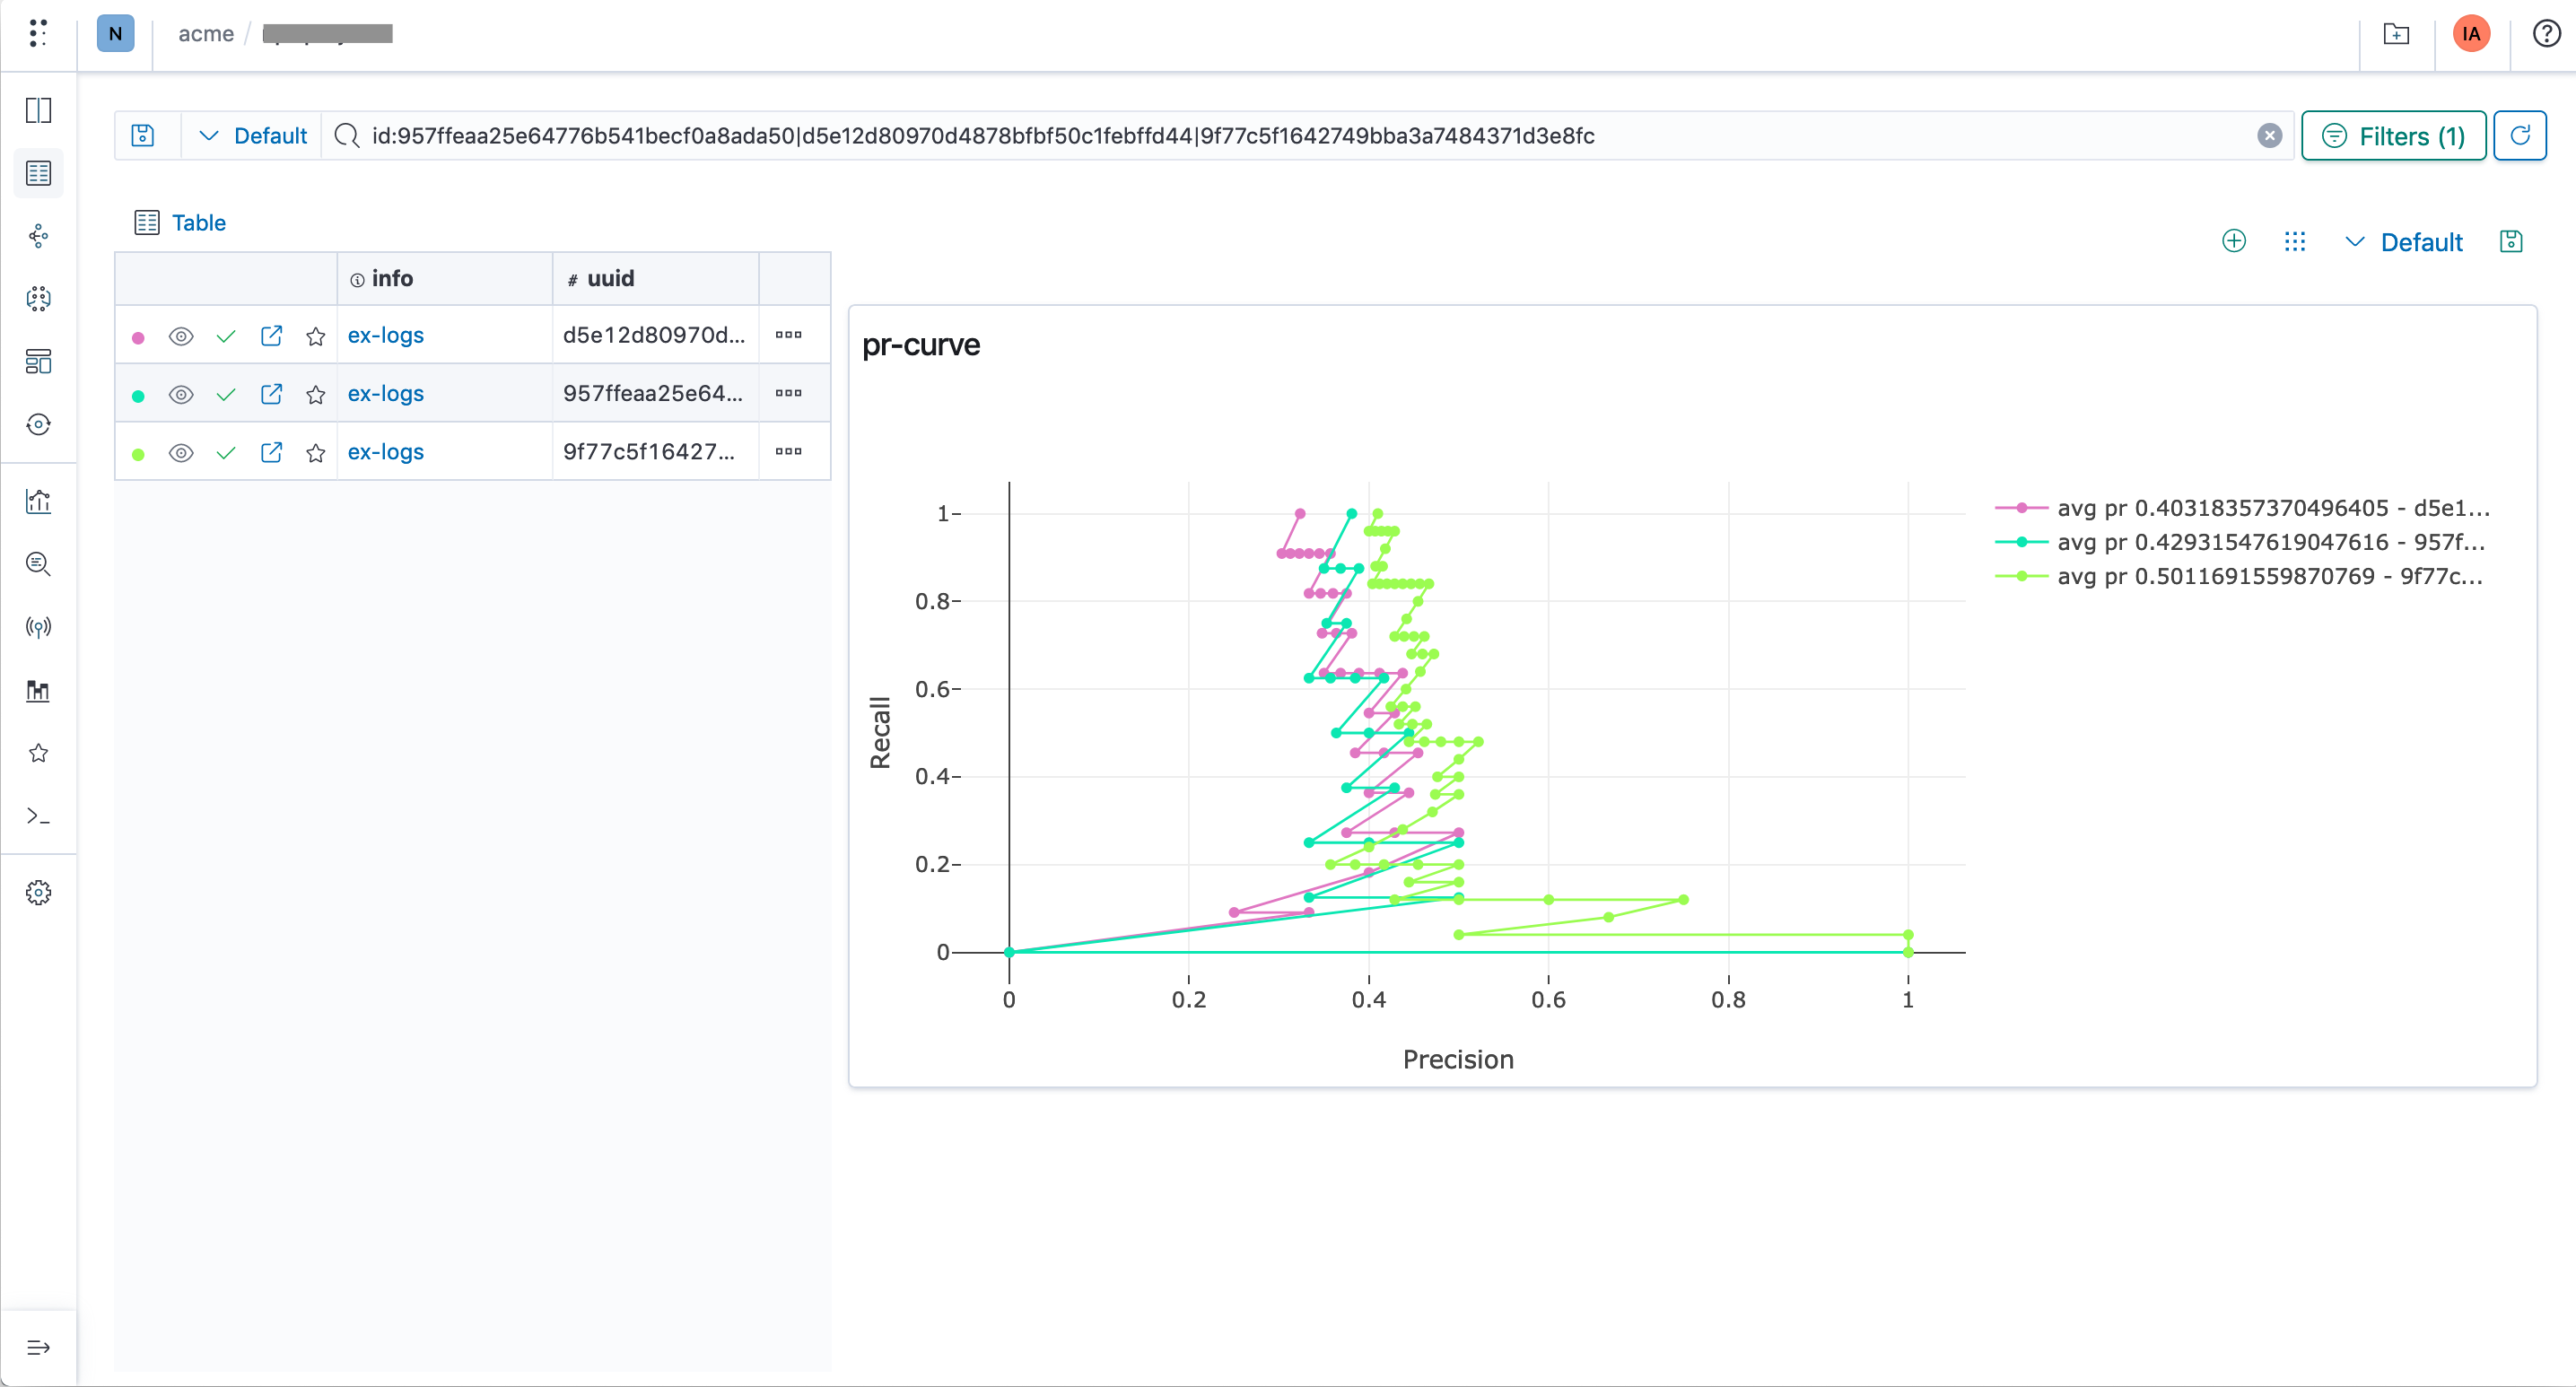
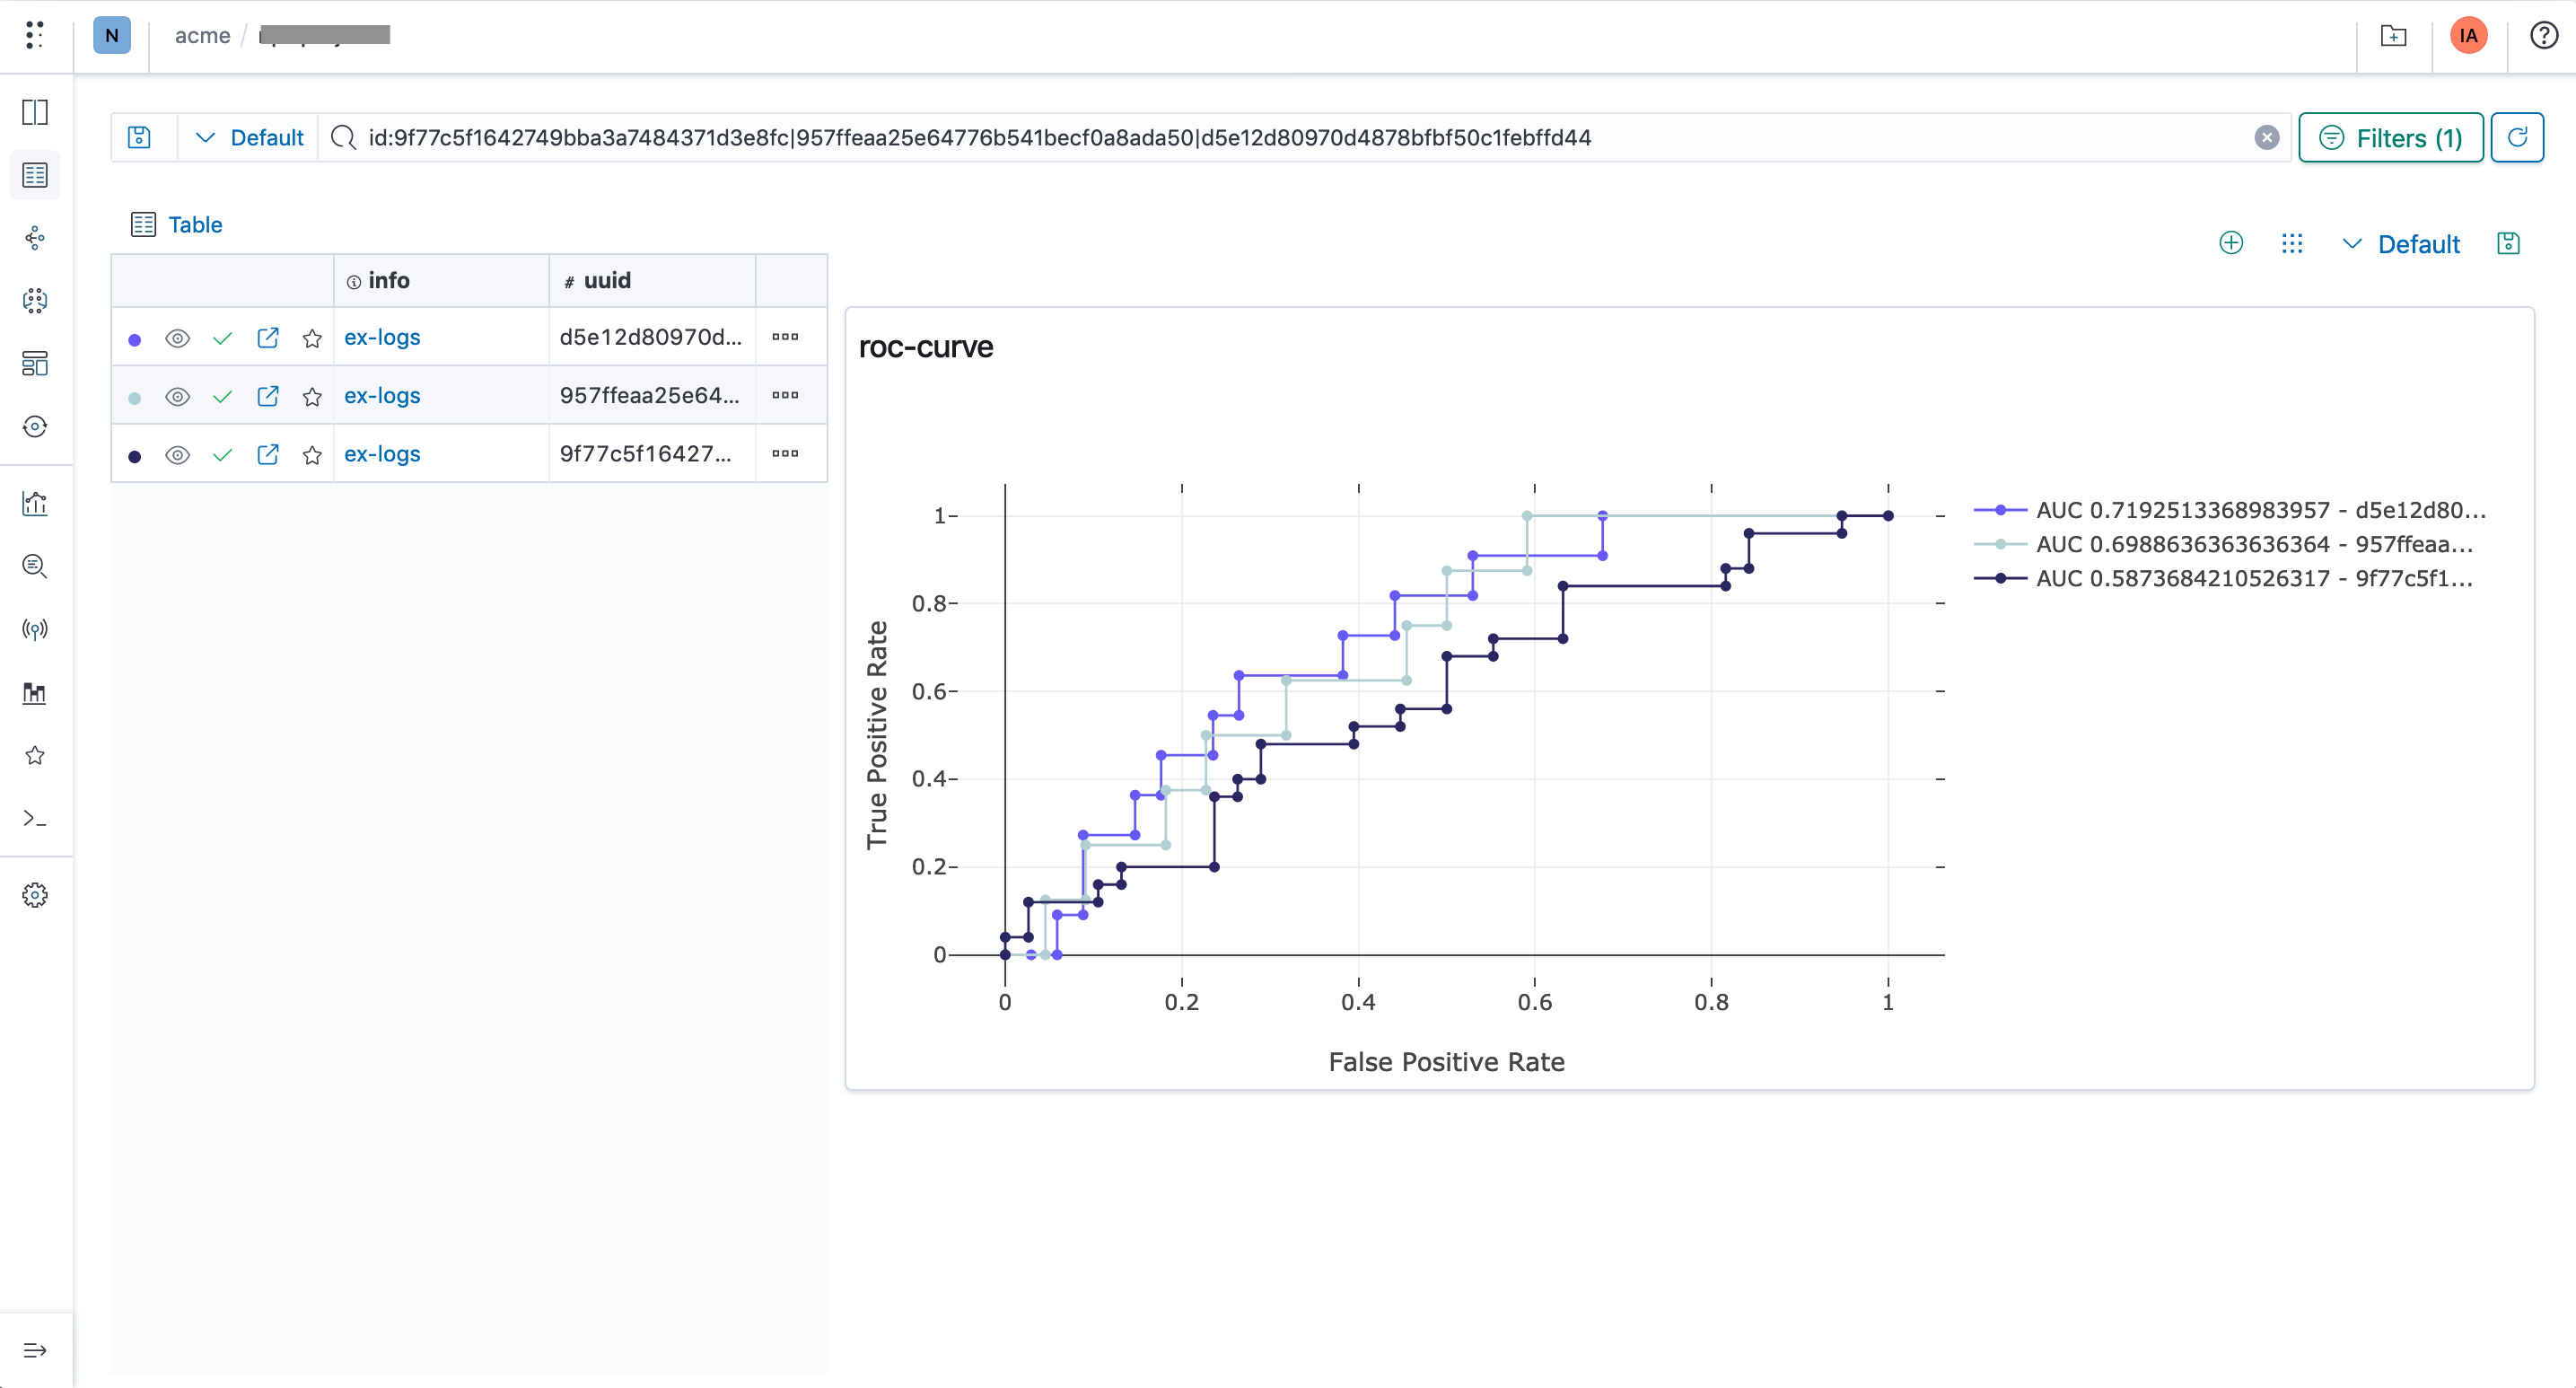
- Curve charts: PR curves, AUC/ROC curves, custom curves (
<x, y>arrays)
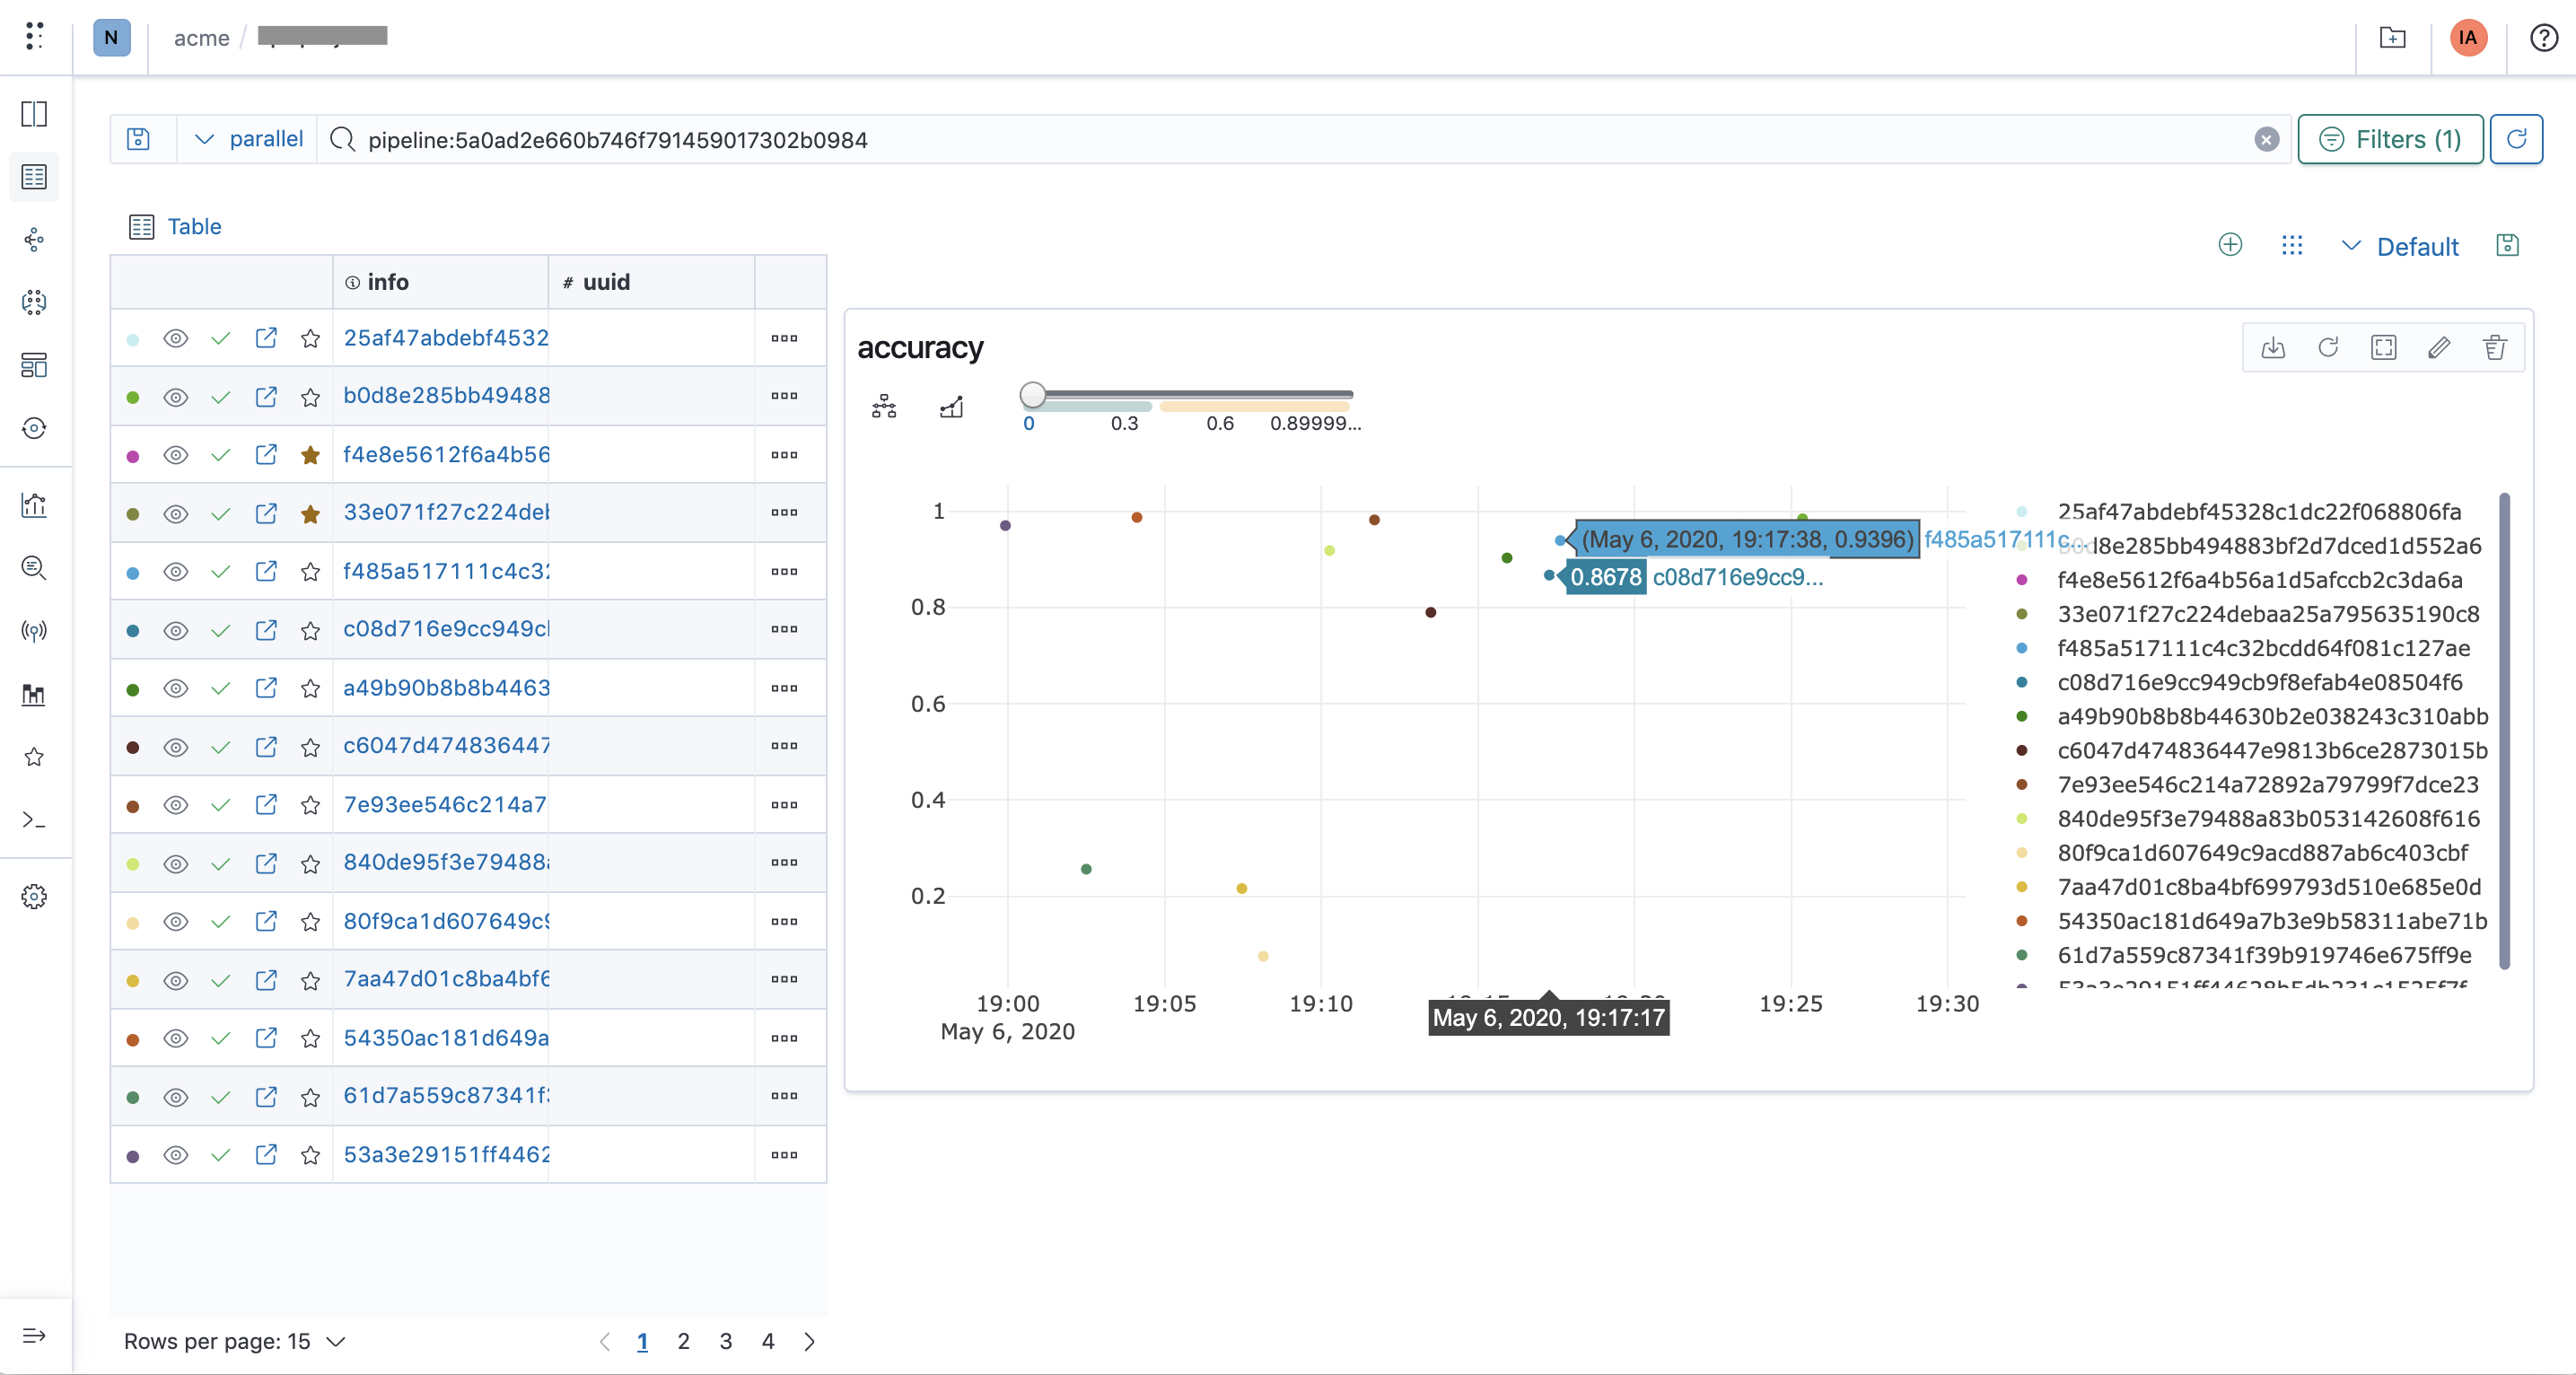
- Scatter charts
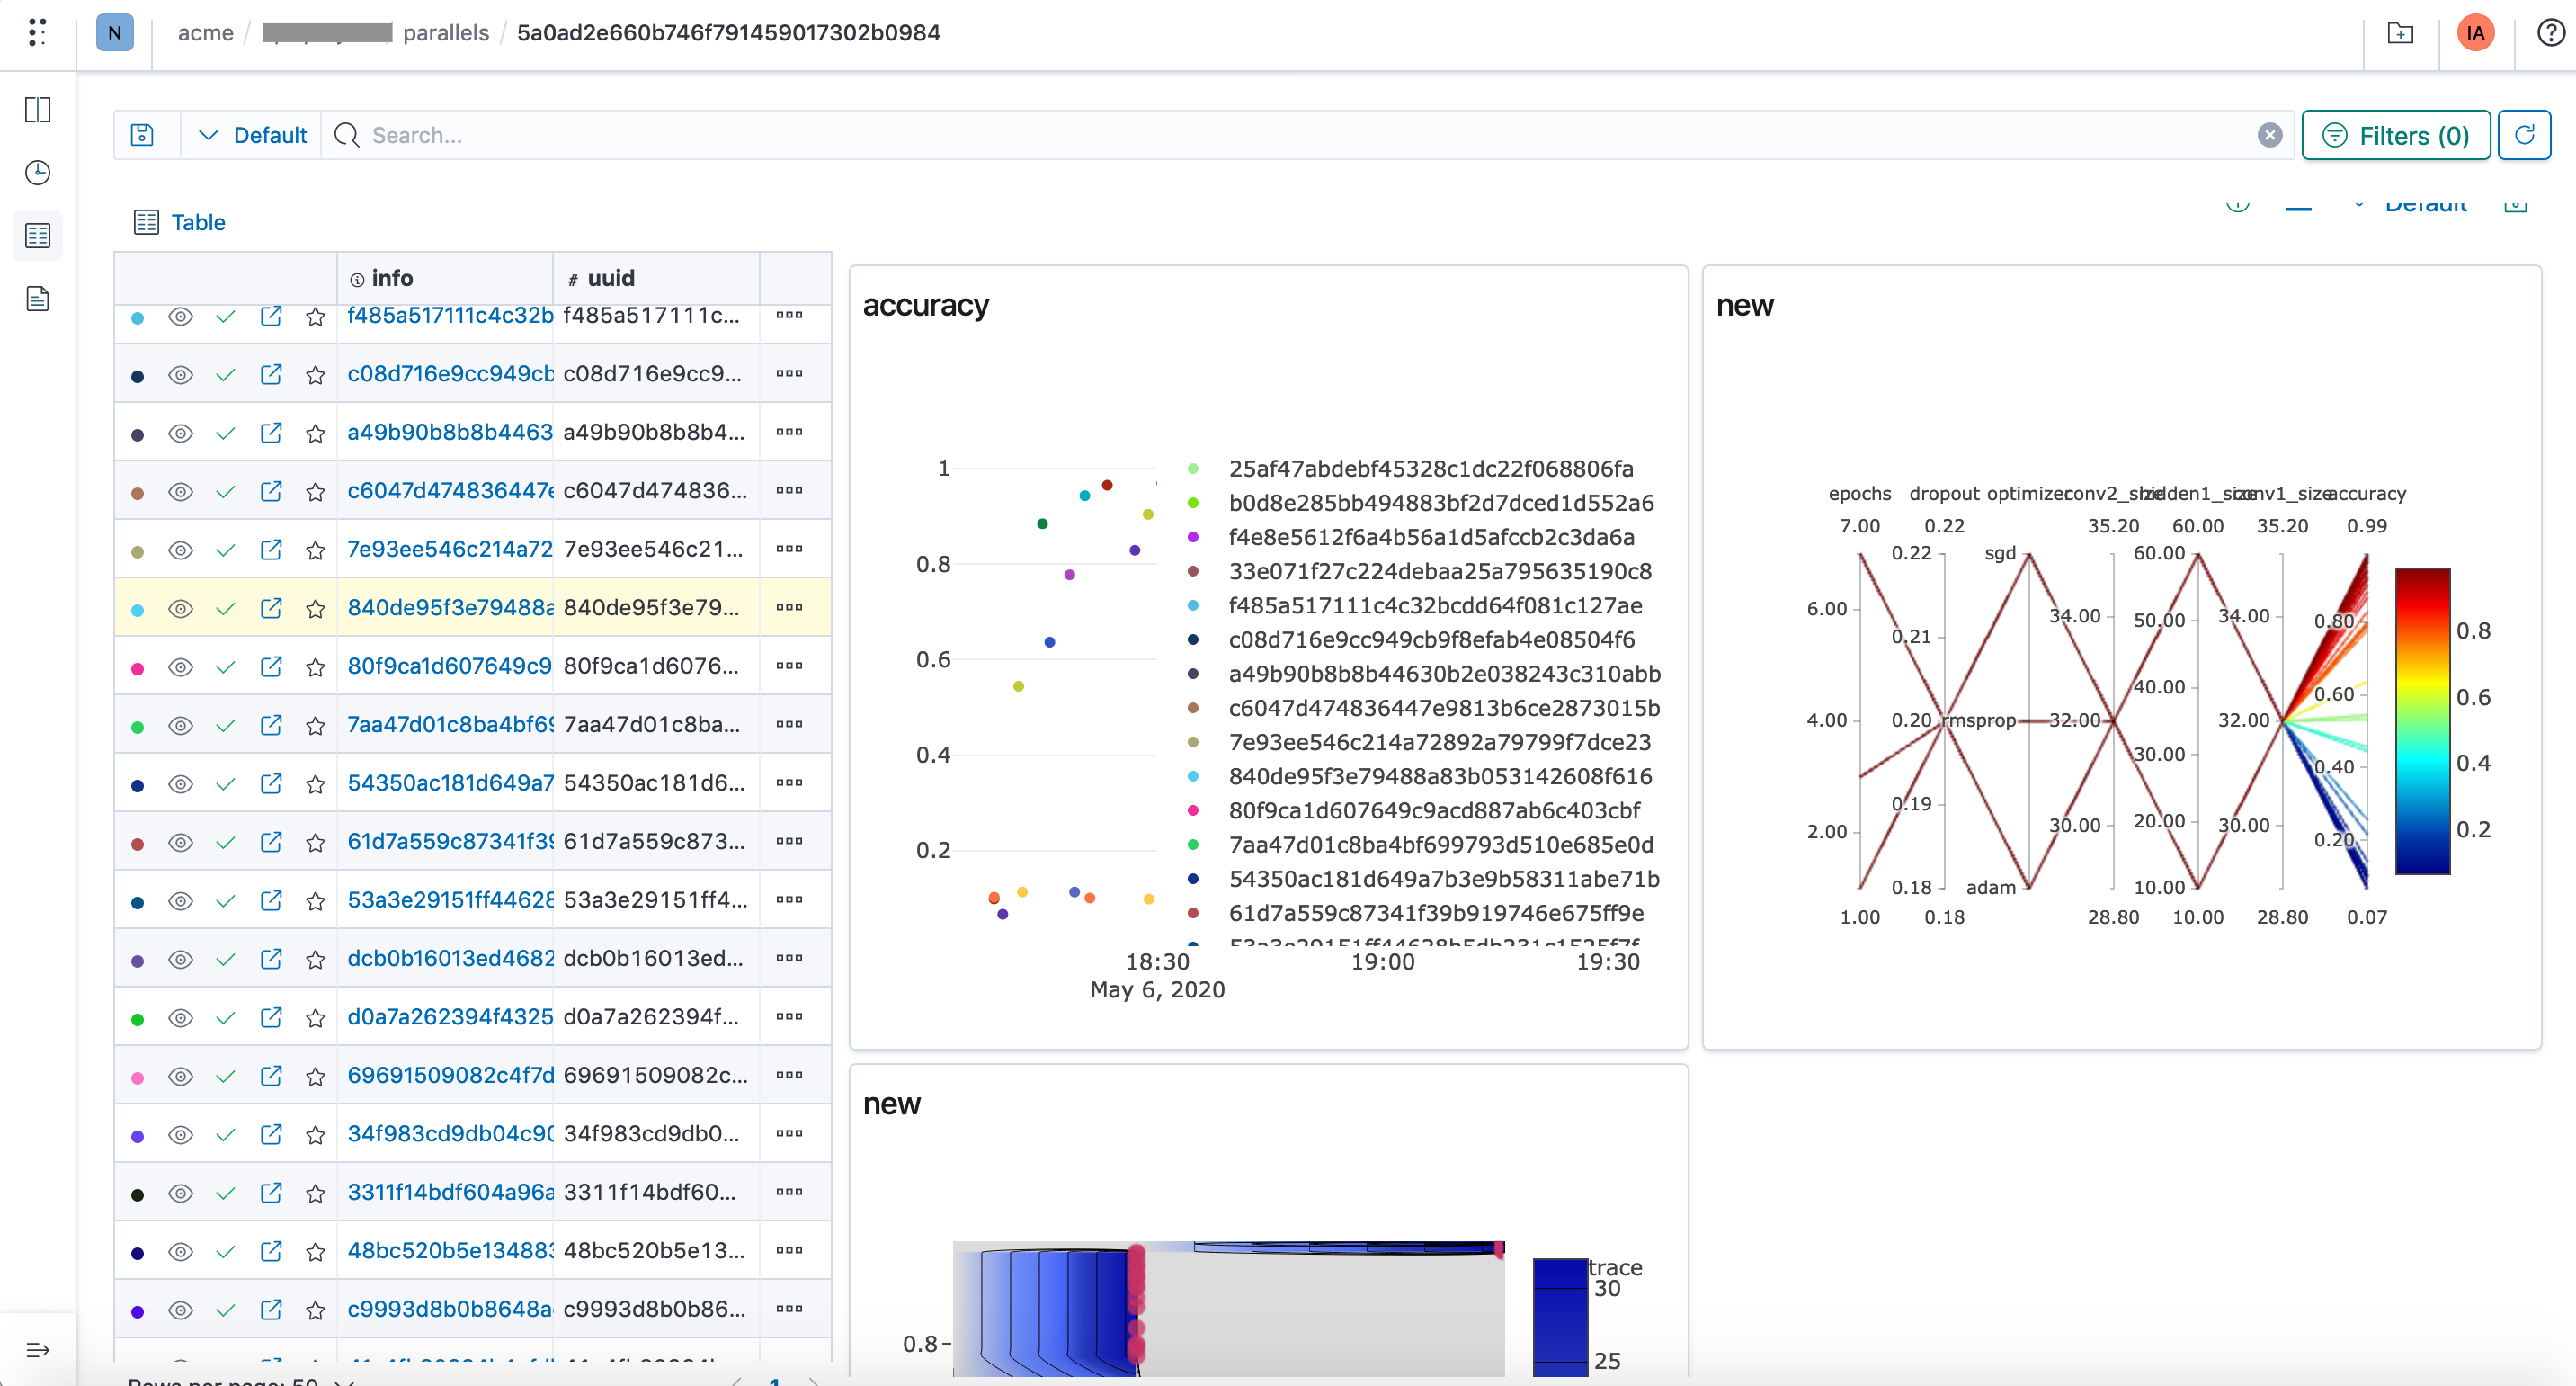
- Parallel coordinates
- Contour plots
Media rendering
Polyaxon can render several media types, you can log several versions of the same media with step index:
- images
- text
- html
- audio
- video
- dataframe