How to use the NGINX Prometheus exporter
Connect NGINX metrics to Prometheus with the NGINX Prometheus exporter and configure scraping for basic service monitoring.
How to use the NGINX Prometheus exporter
Connect NGINX metrics to Prometheus with the NGINX Prometheus exporter and configure scraping for basic service monitoring.

Prometheus can only scrape what is exposed in a format it understands. Exporters bridge that gap for systems that expose useful signals in another shape. The NGINX Prometheus exporter turns NGINX status data into Prometheus metrics.
This is a small example, but the pattern matters: expose service health, scrape it consistently, and connect it to workload ownership before a degraded service becomes a mystery.
What is the NGINX Prometheus exporter?
NGINX is one of the most popular web servers used today, and the NGINX Prometheus exporter is a tool you can use to export metrics from your NGINX server and capture them in your Prometheus instance. While NGINX exposes a basic set of metrics via its stub status module, those metrics are not in a form that Prometheus can scrape. This is where prometheus-nginx-exporter helps. It listens to the stub_status endpoint and generates a feed of Prometheus-friendly metrics on an endpoint. You can then configure your Prometheus instance to scrape data from this endpoint and use it to track and analyze the performance of your NGINX server.
How to use the NGINX Prometheus exporter
To set up NGINX monitoring using Prometheus, you'll need the following:
- An NGINX server
- A Prometheus instance
- The prometheus-nginx-exporter
To start, update your NGINX server's config file to enable the /metrics endpoint by adding the following to your nginx.conf file:
server {
    location /metrics {
        stub_status on;
    }
}
Visit the /metrics route on your NGINX server to see whether metrics have been exposed. You should see a result like this:
Active connections: 1
server accepts handled requests
 7 7 14
Reading: 0 Writing: 1 Waiting: 0
Next, install the exporter in a Docker container by running the following command:
docker run \
  -p 9113:9113 \
  nginx/nginx-prometheus-exporter:0.10.0 \
  -nginx.scrape-uri=http://<nginx ip>:8080/metrics \
  -web.telemetry-path=/metrics
Once the exporter is up, you'll be able to access http://<your-machine-ip>:9113/metrics and see a page with detailed metrics from your NGINX server.
# HELP nginx_connections_accepted Accepted client connections
# TYPE nginx_connections_accepted counter
nginx_connections_accepted 10
# HELP nginx_connections_active Active client connections
# TYPE nginx_connections_active gauge
nginx_connections_active 1
# HELP nginx_connections_handled Handled client connections
# TYPE nginx_connections_handled counter
nginx_connections_handled 10
# HELP nginx_connections_reading Connections where NGINX is reading the request header
# TYPE nginx_connections_reading gauge
nginx_connections_reading 0
# HELP nginx_connections_waiting Idle client connections
# TYPE nginx_connections_waiting gauge
nginx_connections_waiting 0
# HELP nginx_connections_writing Connections where NGINX is writing the response back to the client
# TYPE nginx_connections_writing gauge
nginx_connections_writing 1
# HELP nginx_http_requests_total Total http requests
# TYPE nginx_http_requests_total counter
nginx_http_requests_total 21
# HELP nginx_up Status of the last metric scrape
# TYPE nginx_up gauge
nginx_up 1
# HELP nginxexporter_build_info Exporter build information
# TYPE nginxexporter_build_info gauge
nginxexporter_build_info{commit="7a03d0314425793cf4001f0d9b0b2cfd19563433",date="2021-12-21T19:24:34Z",version="0.10.0"} 1
Next, set up your Prometheus instance to scrape data from the exporter. You can do this by updating your prometheus.yaml file to include the following:
scrape_configs:
  - job_name: 'nginx exporter'
    scrape_interval: 5s
    static_configs:
      - targets: ['<your machine ip>:9113']
Once everything is set up correctly, you'll be able to see the NGINX-related metrics in your PromQL autofill suggestions:
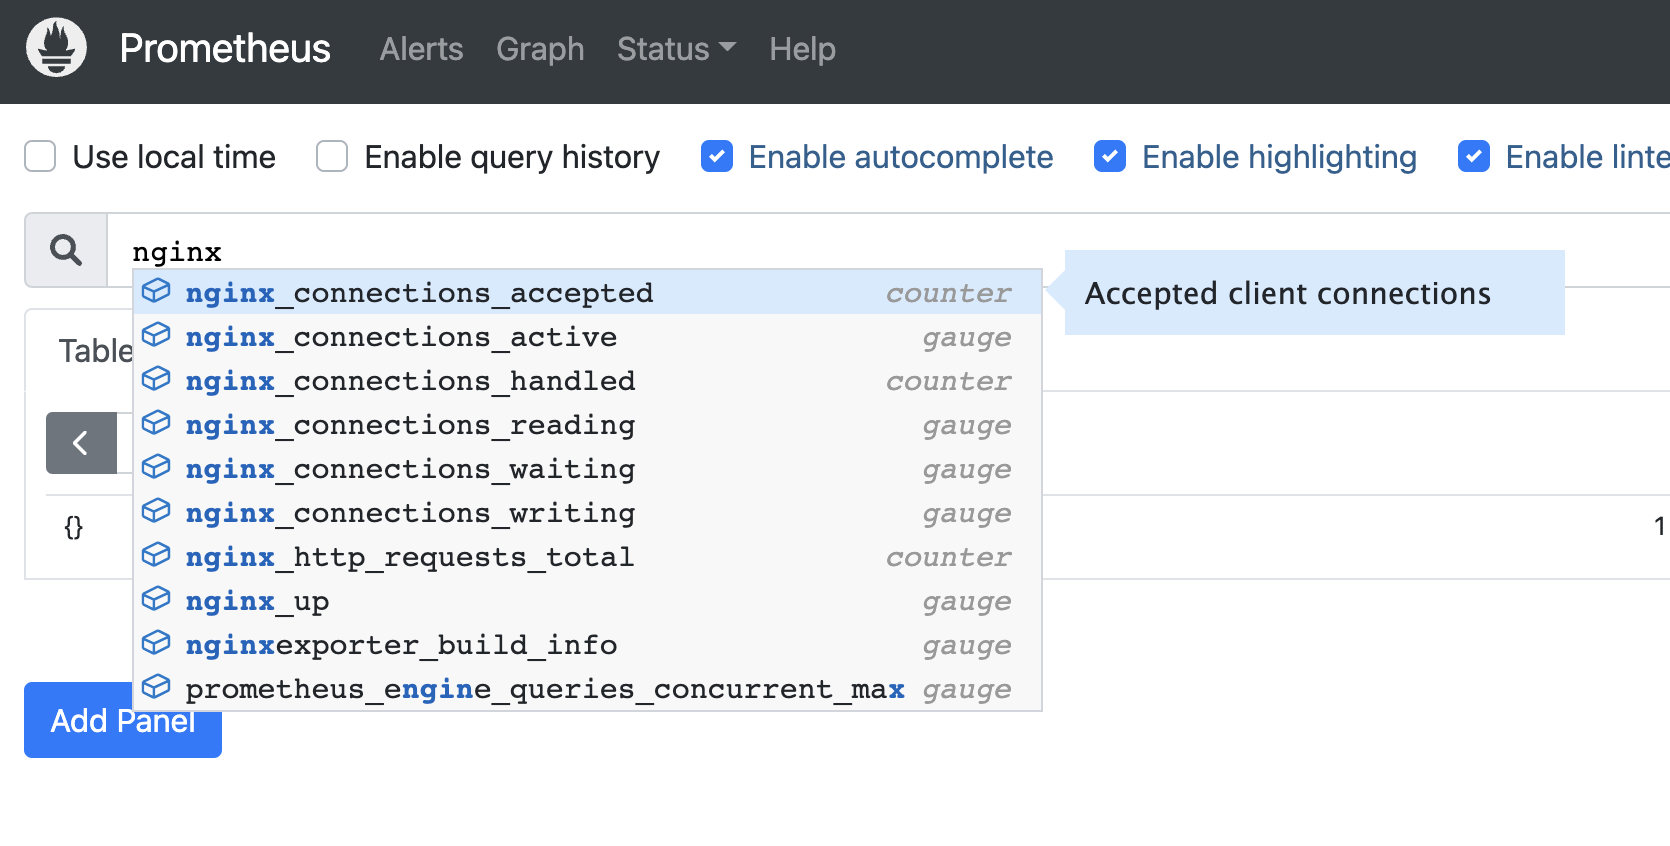
You can now use these metrics in PromQL queries to monitor your NGINX server and draw visualizations using other tools, such as Grafana.
Final thoughts
The NGINX exporter is a straightforward example of a broader monitoring pattern: expose service metrics, scrape them consistently, and make the labels clear enough to debug later.
For Polyaxon deployments, this same thinking applies to platform services and user workloads. Metrics are more useful when they can be connected to projects, runs, queues, and owners.