Today, we are pleased to announce the v1.0.8 release of our MLOps platform, a stable version which brings significant improvements to Polyaxon’s user experience.
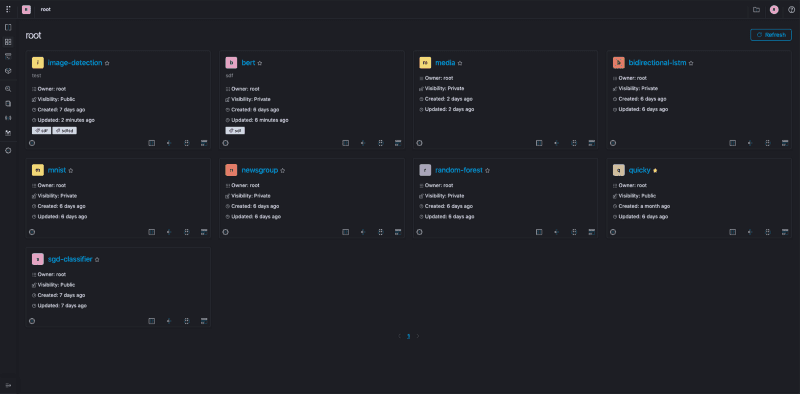 Polyaxon in dark mode
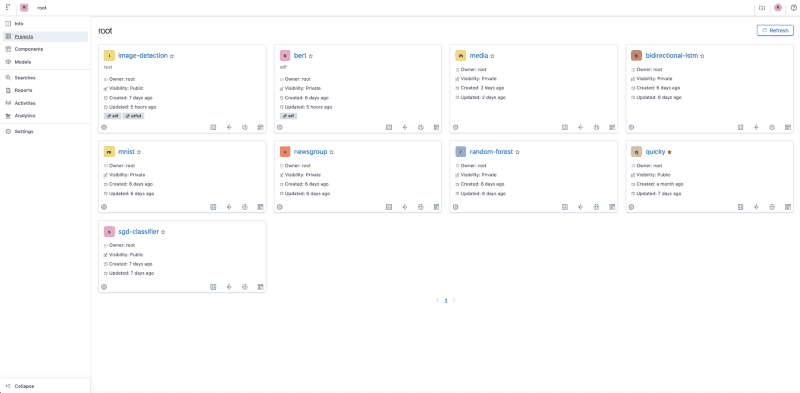 Polyaxon in light mode
With v1.0.8, we are fixing several usability issues, and introducing new functionalities to increase the productivity of Polyaxon’s users.
The new experience is now accessible to all paying customers and will be accessible to all open-source users starting from v1.1.
Polyaxon is a cloud native machine learning automation platform.
Since the release of Polyaxon v1, we have been talking with several Polyaxon’s customers to gather feedback, pain points and possible enhancements to bring to the platform. Polyaxon has seen a steady growth, collectively our tools have been downloaded more than 13.5M times (via public Docker Hub). Today we are releasing a new version to address some of the feedback we have been hearing.
TL.DR.
Improved CLI experience:
- Better logs storage and streaming.
- Uniform and standardized polyaxon run command.
- Uniform and standardized polyaxon ops command for getting information about runs.
- New polyaxon watch command for watching new events and conditions.
Improved programmatic experience:
- New language sdks fully typed: Python, golang, Javascript/Typescript, Java.
- Rich experience to create Polyaxonfiles in Python, as well as feature parity with CLI commands, i.e. creating runs, streaming logs, watching events, … for 100% programmatic experience.
- Apis to load metrics as csv or pandas dataframes.
- Improved tracking experience with the class Run instantiation or using the polyaxon.tracking module.
- Possibility to achieve almost 0% impact on training performance, and 100% Polyaxon agnostic code using the automated data/outputs management.
Improved UI experience:
- Streaming logs in UI with possibility to sort and search logs (in real time), and better handling for progress bars and ansi colors.
- New events/statuses page: better observability and streaming of events.
- New resources tab for monitoring cpu/memory/gpu per run.
- Improved artifacts tab with possibility to download single files, sub-paths, and all artifacts. Better detection for file types: detection of all language codes and display in proper code editors, better detection of media types, in addition to images, there’s a detection for audio, video, and html files with proper rendering.
- Improved dashboarding/visualization experience for single runs: in addition to the line charts, bar charts, and stats charts, users can now have access to an extremely rich experience with proper handling for several event types: Histograms, ROC/AUC curves, Precision/Recall curves, Custom curves, Custom charts based on Plotly/Bokeh/Vega, text, html, audio, video, dataframes.
- New lineage tab for displaying all inputs and outputs for a run, the provenance of the artifacts, and special detection for several types.
- Improved experience for the table/comparison experience: scales to a large number of columns, possibility to sort by several fields, new multi-runs actions, explore runs in flyout mode without leaving the table, and better multi-runs visualizations.
- Dark Mode in beta.
Improved Tensorboard integration and dashboarding experience:
- Possibility to start Tensorboards based on outputs generated outside of Polyaxon.
- Tensorboads based on a filters, tags, or any condition.
- Performance based tensorboards, i.e. tensorboard for runs with specific metrics performance.
- Possibility to drive more dashboards using streamlit, bokeh, voila, …
Per run plugins and notifications (slack, webhooks, …) settings in addition to the global configuration.
Keep reading to find out all new aspects of our improved experience.
Improved CLI experience
The CLI has been an important aspect of Polyaxon since the very first release, it allows users to start experiments and jobs, display and stream logs, explore projects, and compare runs.
Creating runs
Before the v1 release, Polyaxon had a specific command for experiments, jobs, builds, notebooks, tensorboards. Several of those commands were providing similar functionality, but from the users’ perspective there were too many commands. Starting with Polyaxon v1, we provide one experience for starting runs (experiments, jobs, notebooks, tensorboards):
polyaxon run -f tensorboard.yamlpolyaxon run -f classifier.yamlCreating runs from urls, python modules, Polyaxon hub, yaml files
Yaml files were traditionally used to start runs on Polyaxon. Now users can start runs based on files stored locally or on a url (e.g. github raw):
polyaxon run --url ...With the inroduction of Polyaxon pipelines, polyaxonfiles started to grow in complexity, although our yaml file experience allows composition and inheritance, several users prefer using a programming language to create these operations.
With Polyaxon v1 you can create a Polyaxonfile in python, and use the Client or the CLI to start the run:
polyaxon run -pm file.py:componentAThe new -pm (--python-module) flag allows users to point to a python file and optionally the component to run, and the cli will automatically load and validate the Polyaxonfile created inside the python file, e.g.
operation = V1Operation(
    params={
        "learning_rate: 0.1,
        "batch_size": 124,
    },
    termination=V1Termination(max_retries=3),
    hub_ref="my-org/classifier:v2.1"
)
The python file experience is also used within Polyaxon to start jobs on kubernetes, e.g. the notification tasks:
V1Component(
    name="slack-notification",
    plugins=V1Plugins(
        auth=False,
        collect_logs=False,
        collect_artifacts=False,
        collect_resources=False,
        sync_statuses=False,
    ),
    inputs=[
        V1IO(name="kind", iotype=types.STR, is_optional=False),
        V1IO(name="owner", iotype=types.STR, is_optional=False),
        V1IO(name="project", iotype=types.STR, is_optional=False),
        V1IO(name="run_uuid", iotype=types.STR, is_optional=False),
        V1IO(name="run_name", iotype=types.STR, is_optional=True),
        V1IO(name="condition", iotype=types.STR, is_optional=True),
        V1IO(name="connection", iotype=types.STR, is_optional=True),
    ],
    run=V1Notifier(
        connections=[connection],
        container=get_default_notification_container(),
    ),
)
Additionally if a components is mature enough, you can register it in Polyaxon’s components hub, and users can can run it using the cli:
polyaxon run --hub my-org/my-component:versionUniform experience for all operations
Whether you are starting a job, a distributed machine learning experiments, a Ray or Dask job, or a tensorboard, Polyaxon now provides a standard experience for starting, watching, logging, and getting information about those operations.
Improved programmatic experience
With Polyaxon v1 we introduced several language sdks fully typed: Python, golang, Javascript/Typescript, Java, some of these sdks are used in Polyaxon for driving the API/Scheduler, the operator, the agent, or the UI.
Several Polyaxon users are part of devops teams or are engineers who have more use-cases outside of Polyaxon, and they tend to build new features and tools for their companies. The new language sdks and clients will allow them to have the best programmatic experience to fully automate every aspect of their day-to-day journey.
Python is still and will be the most advanced client we provide, and in this version you can do 100% all operations in a programmatic way. We provide high level modules for managing the lifecycle of a run: https://github.com/polyaxon/polyaxon/blob/master/core/polyaxon/client/run.py
For data-scientists who tend to track information related to their runs, e.g. scalars, metrics, notes, … you can now access an extremely rich tracking API to track anything from common and standard metrics to custom visualizations in matplotlib, images, plotly, vega, and bokeh.
Our new tracking experience comes in 2 flavors:
from polyaxon.tracking import Runexperiment = Run()
experiment.log_metric(...)
experiment.log_image(...)- A high level module: https://github.com/polyaxon/polyaxon/blob/master/core/polyaxon/tracking/
from polyaxon import trackingtracking.init()
tracking.log_metric(...)
tracking.log_audio(...)
Polyaxon comes also with several integrations for Keras, Tensorflow, Fastai, Pytorch for streamlining the tracking experience.
Finally you can use the new modules to drive more insights and visualizations in Notebooks, streamlit, voila, …
Logging experience
Let’s start by outlining some issues that users were facing in the previous version of Polyaxon, some of the issues are taken from https://github.com/polyaxon/polyaxon/issues
- Logs disappears if pod crashes
- Logs streaming maxes out at a few messages per second
- Better debugging experience: errors in init/sidecar containers require accessing the Kubernetes pods, often times not possible for some users because they don’t have access to the cluster or they don’t know Kubernetes to do so.
- Tensorboards and Notebooks crashes were hard to debug
- Logs timestamps are not localized
- Add ‘scroll to bottom’ button for logs
- How to print logs in notebooks
Polyaxon v1 brings a fully uniform logging experience to all runs
experiments, jobs, notebooks, tensorboards, … have now a similar logging experience, which help users detect issues related to why a tensorboard is not loading or a notebook is not accessible.
The logging experience is improved throughout the platform: CLI, Clients, and UI.
Polyaxon now streams and stores logs of all containers, and for all runs
- This will reduce the need to reach out for kubernetes to check per container issues

Logs with info about nodes/pods/containers
You will less likely need to restart a job with debug and ttl mode, since most the information is now accessible in the logs.
 Logs streaming
Logs streaming does not limit the number of log lines per second. And all timestamps are localized.
Logs in UI have been improved as well
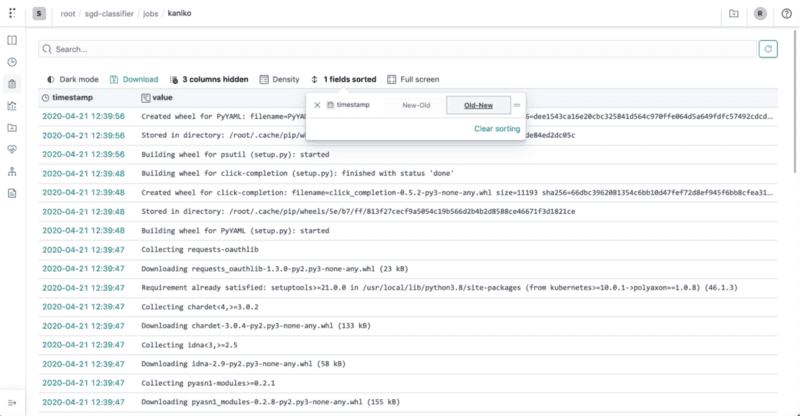 Polyaxon logs sorting
You can stream logs in the dasboard as well with better support for progress bars, ANSI standards, and long log lines.
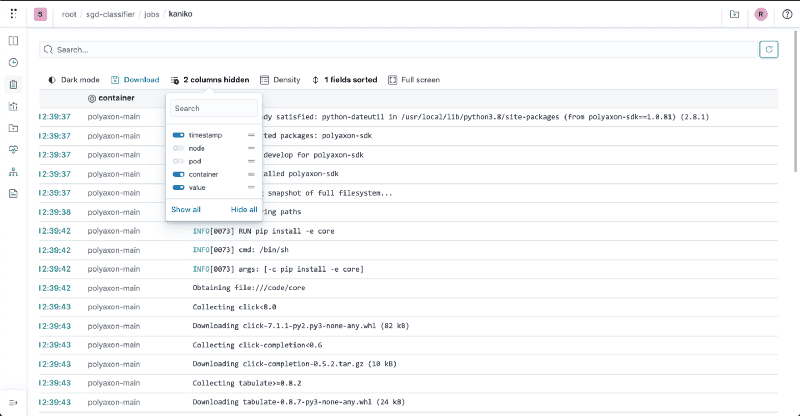 Polyaxon logs columns info
It’s possibility to hide/show information about nodes, pods, and containers, this is especially important for distributed runs, or restarts. And you can sort logs by latest timestamp first and keep streaming new logs to avoid scrolling to bottom
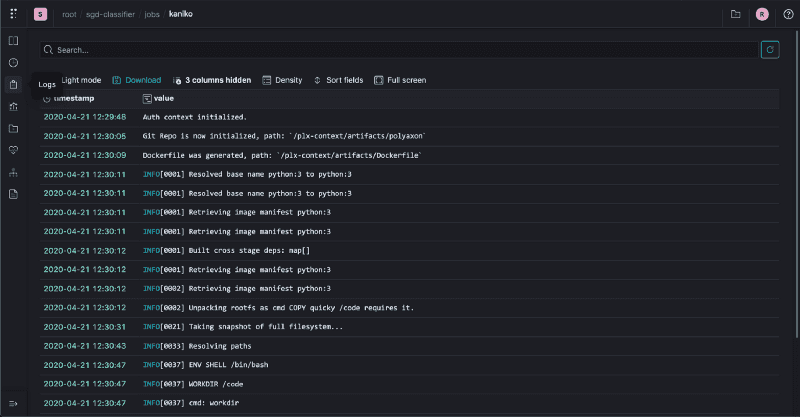 Logs in dark Mode
The logs have similar experience in the dark mode as well.
It’s also possible to disable logs storage for a specific experiment or based on a specific tag, e.g. users might want to avoid storing logs for debug jobs.
Polyaxon observability and monitoring
Polyaxon has now a much better observability and monitoring for resources as well as statuses, events, and conditions.
The CLI has a new command argument --watch -w for watching statuses and events in real time, same with the UI, it streams the statuses and provide much deeper insight about the conditions of the underlaying pods.
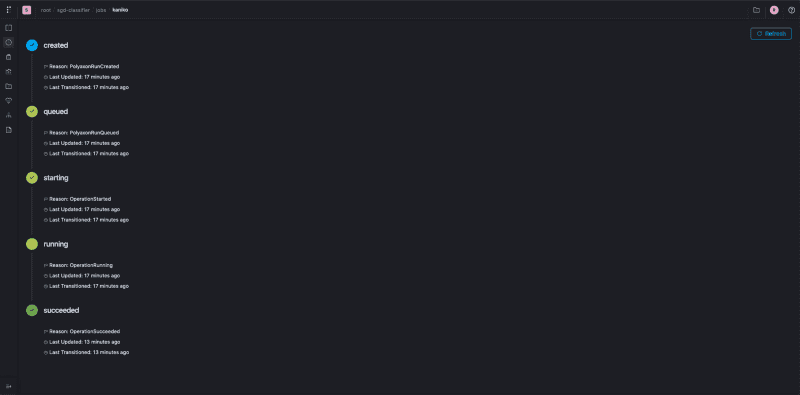 Statuses in dark mode
Jobs resume in place, which means you get to see the events and logs in the same orginal run.
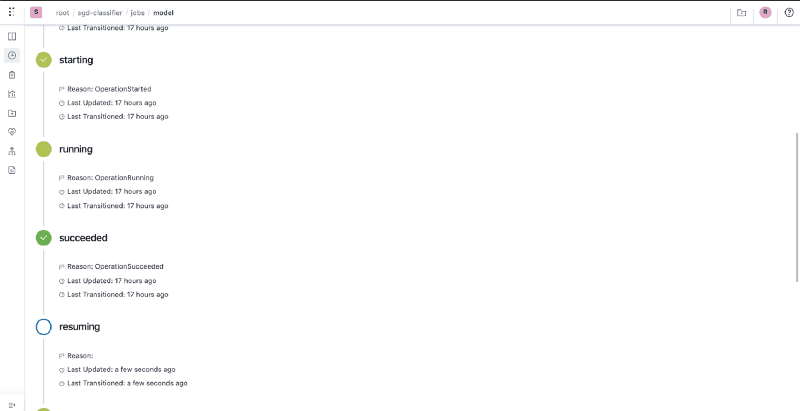 Polyaxon statuses
It’s also possible to track resources usage and plot them in the dashboard.
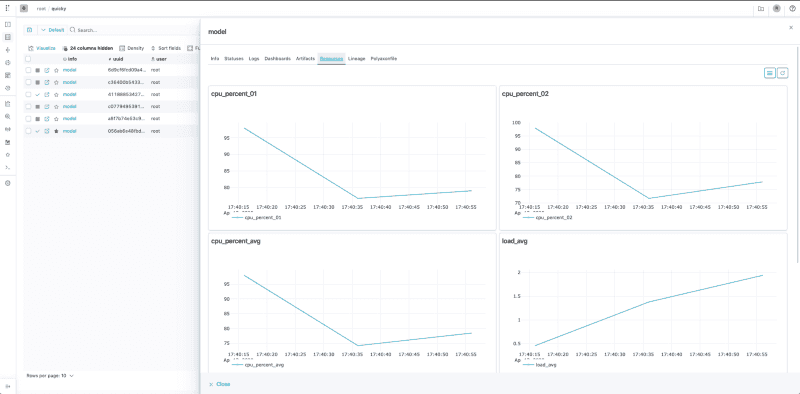
Improved dashboarding experience for runs and experiments
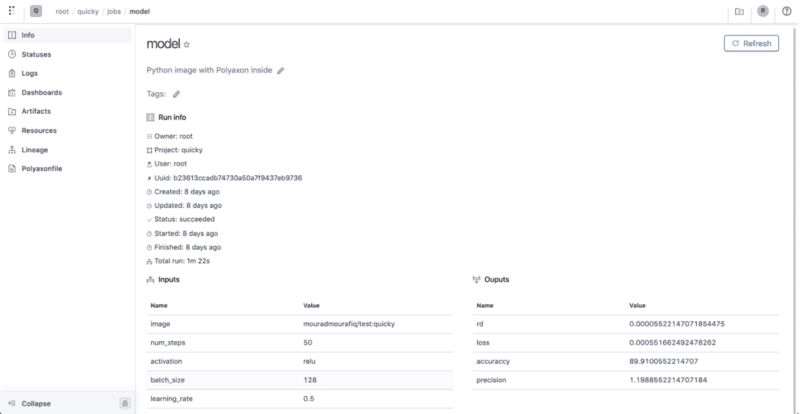 Info page
Polyaxon UI has seen a huge improvement for organizing information related to jobs, experiments, and services.
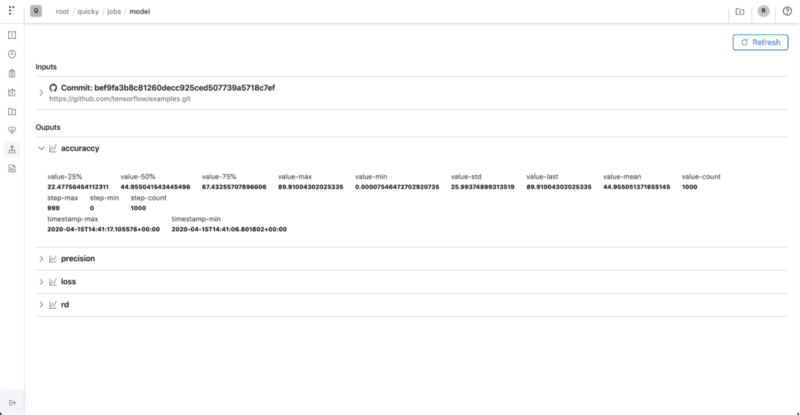 Lineage page
The new dashboard comes also with a lineage tab with deeper information about inputs and outputs artifacts, with special handling for several types: git, dockerfiles, files, events, metrics, …
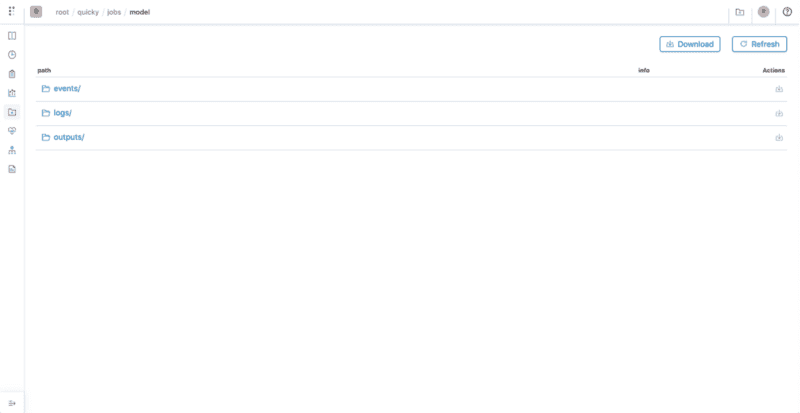 Outputs page
The outputs page allows to download single artifacts, subpaths or pull everything that was stored in the artifacts store for a specific run. The same experience is also possible through the API and the Python client.
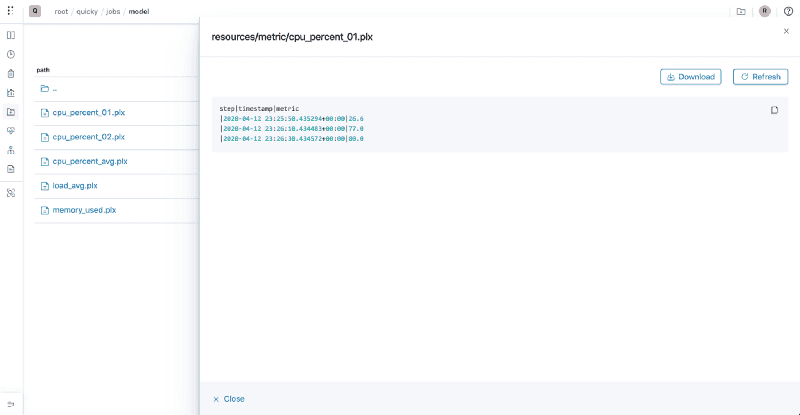 Outputs page file rendering
The outputs tab has an enhanced filetype detection with proper rendering for media and editors for code files. All widgets have a fullscreen mode and the possibility to download the artifact/asset.
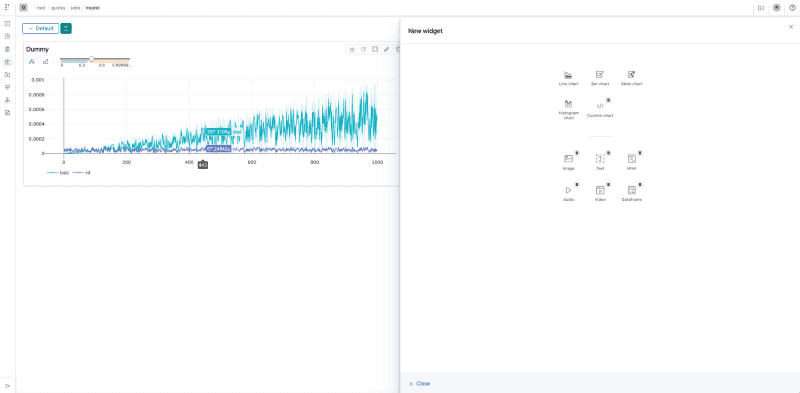 Polyaxon metrics dashboard
The new dashboard tab (previously metrics tab) provides a very rich rendering widgets. Users can refresh single widgets without fully reloading the view. Any dashboard saved is accessible to all other experiments within the project, with the possibility to promote the dashboard to the organization level.
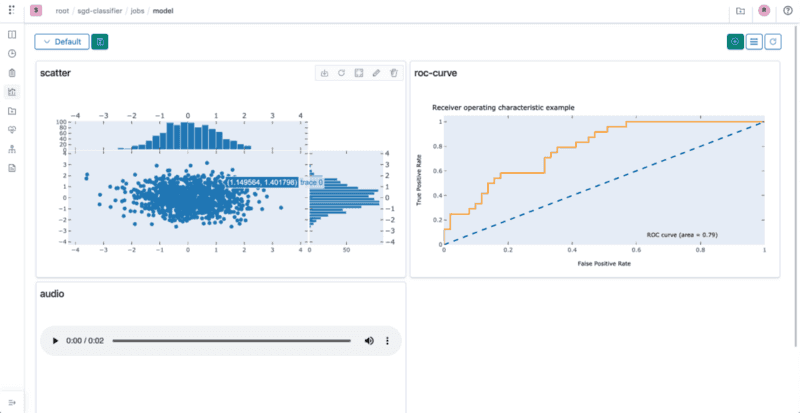 Dashboard widgets
It’s also, possible to render media assets, advanced curves, and add custom charts and visualizations.
Polyaxon tensorboard integration
Polyaxon had a Tensorboard integration since the first public release. Previously users could start tensorboard for a single experiment or for experiment groups.
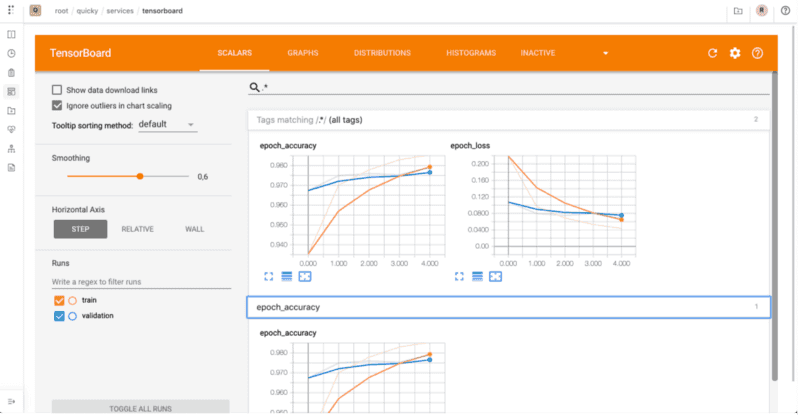
The new Tensorboard integration provides several new possibilities to start a Tensorboard for runs with specific tags, or based on the performance of a specific metric(s).
Tensorboards, notebooks, streamlit, and any other custom service, are by default managed inside the dashboard, with the possibility to open it in it’s own page.
Polyaxon table and comparison experience
The polyaxon table experience includes several new features:
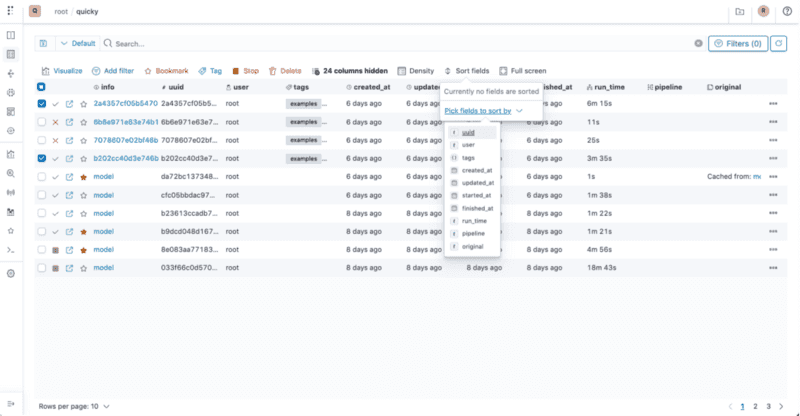 Polyaxon table comparison
You can sort by several fields.
Selecting runs provide a new multi-actions for stopping, deleting, tagging, bookmarking, and visualizing runs.
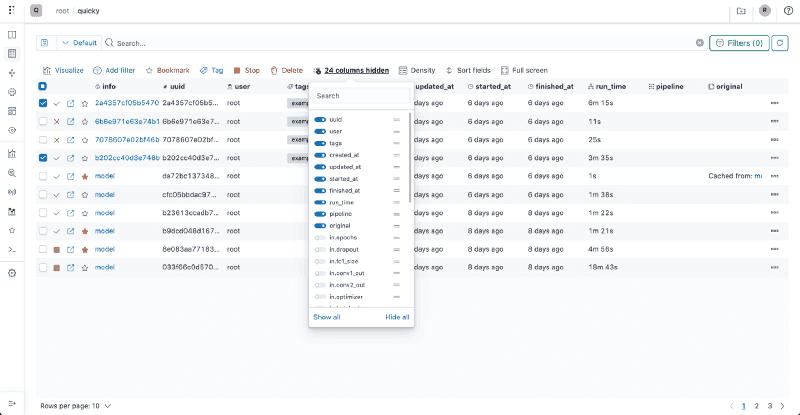 Custom columns and custom width
The new table can scale to a large number of columns with better scrolling experience, better pagination and limit sizes.
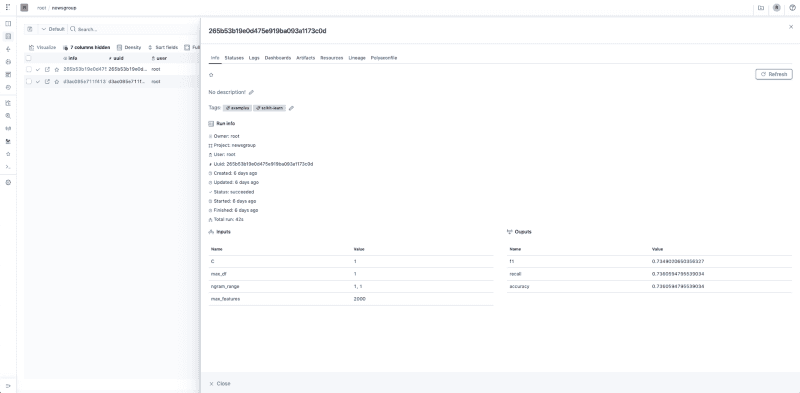 Polyaxon flyout mode
the new table also comes with a new flyout mode for looking at a specific run or an experiment without leaving the table.
Polyaxon multi-runs dashboards and visualizations
It’s not required anymore to create a selection to visualize multiple runs.
You can visualize all runs, or use the search bar to restrict runs based on a metric, e.g. loss, or a regex, or any filter.
In case of several thousands of experiments, sorting and page limits are helpful to get the right number of experiments to visualize.
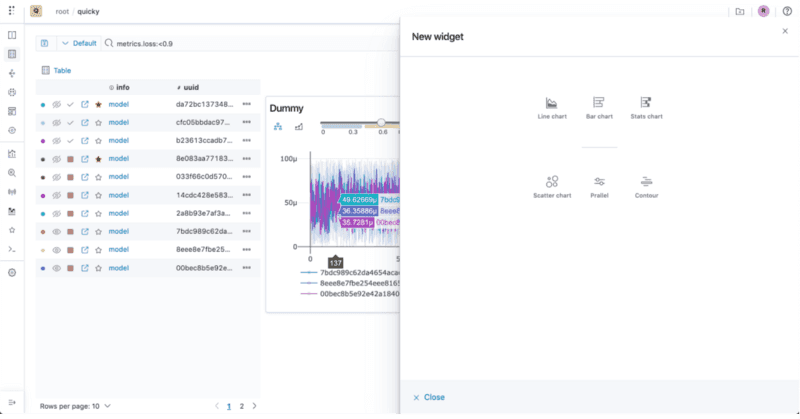 Polyaxon multi-runs visualization widgets
The new comparison dashboards allows to control the colors and runs to hide/show in a very simple way.
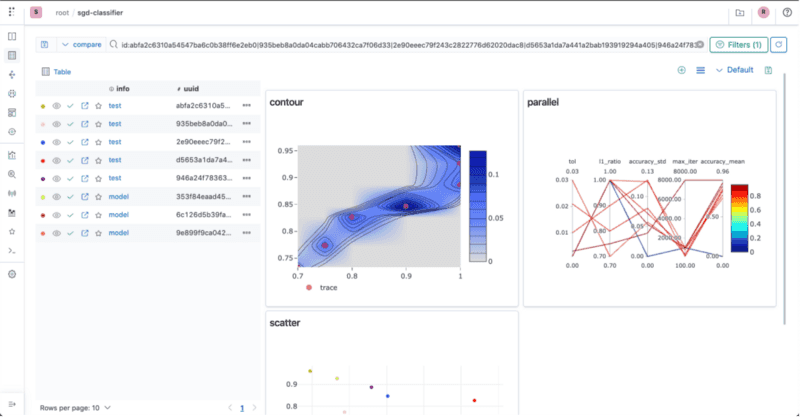 Polyaxon multi-runs dashboard
Polyaxon’s new UI is 100% offline
Finally the new Dashboard is 100% offline, whether you are using the full on-prem version or the cloud version, the dashboard does not require access to the internet and follows any netwoking policies or VPN within your organization.
Learn More about Polyaxon
Polyaxon continues to grow quickly and keeps improving and providing the simplest machine learning layer on Kubernetes.
To learn more about all the new features, fixes, and enhancements, follow us on
