This is part of our commercial offering.
Polyaxon provides tools to drive analytics and insights about your operations, and to monitor the performance of the workloads over time.
Note: advanced searches, drill down capabilities, and large intervals are part of Polyaxon EE.
Overall counts and stats
Open the organization's Info page to see Stats and Trends. Stats summarizes runs, compute time, projects, versions, and archived entities. The trend tabs compare these values with the selected comparison period.
Select Statuses to compare run outcomes with the selected period. Each card shows the current count and its trend; use Compare to to change the comparison period.
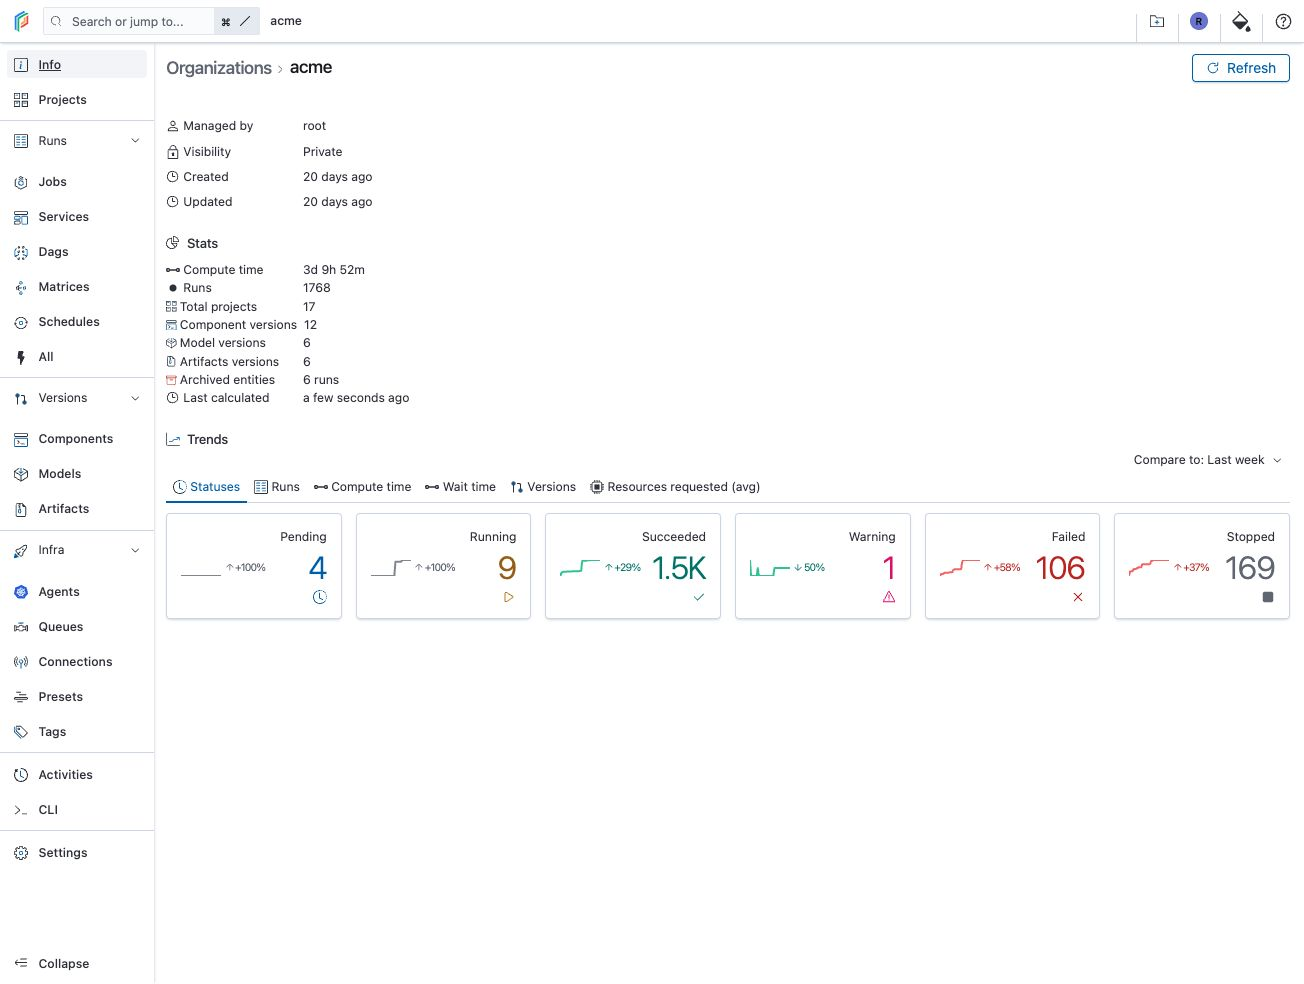
Select Runs to compare total, active, archived, and deleted run counts.

You can also explore Compute time, Wait time, Versions, and Resources requested (avg) to compare execution time, queue delays, version counts, and average resource requests across your organization.
Duration series
Open Runs → All, then use Layout to enable Analytics. Choose View: Series and Group by: Duration to plot duration statistics over time. Trunc by selects the timestamp to group, and Frequency controls the interval.
The screenshots use synthetic documentation history from acme/demo, selected with a tag filter. Use Projects to select a project, or apply other run filters to focus the charts.

Run histograms
In the same Analytics section, choose View: Histograms to see run counts grouped by status. Use the date filter to select the reporting period and Frequency to change the bucket size.
