Timeline view
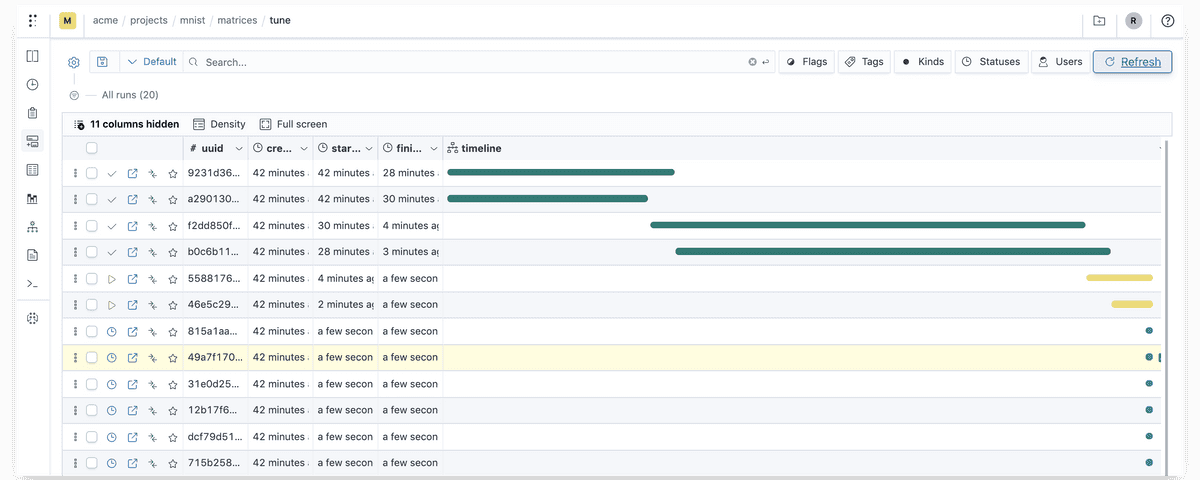
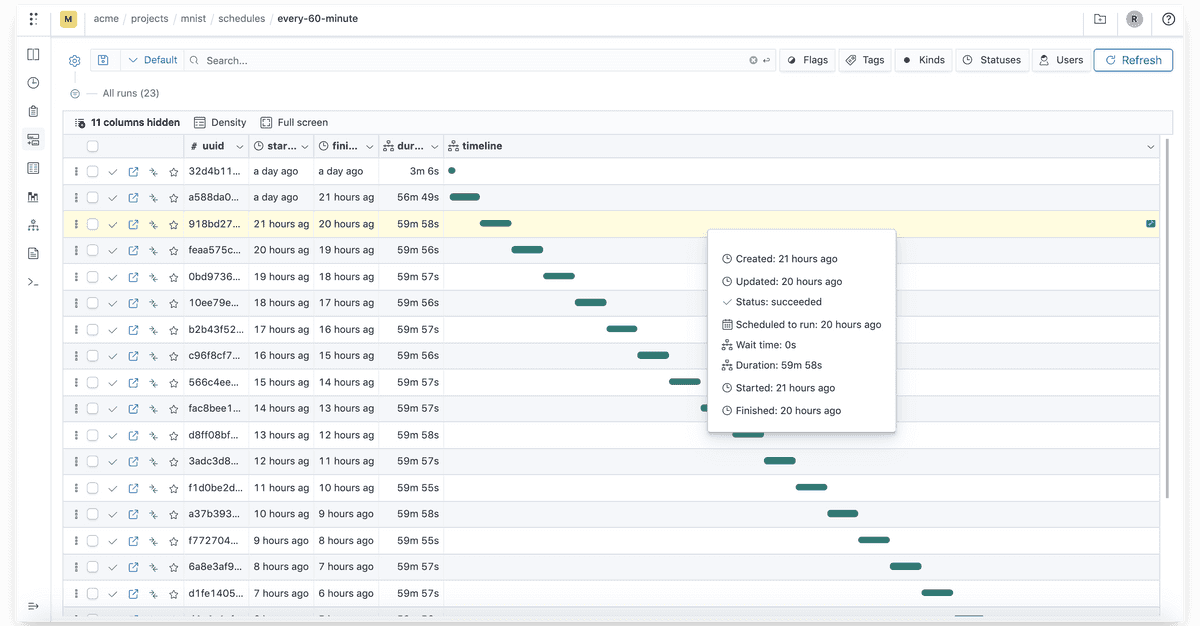
If you are running DAGs, hyperparam tuning jobs, or schedules, you can take advantage of the new view that shows an aggregated table of all dependent runs of that pipeline and a Gantt chart to show a visual timeline of when they started and finished.
- Timeline for a matrix definition

- Timeline for a DAG definition

- Timeline for a cron schedule

Learn More about Polyaxon
This blog post just goes over a couple of features that we shipped since our last product update, there are several other features and fixes that are worth checking. To learn more about all the features, fixes, and enhancements, please visit the release notes.
Polyaxon continues to grow quickly and keeps improving and providing the simplest machine learning abstraction. We hope that these updates will improve your workflows and increase your productivity, and again, thank you for your continued feedback and support.


