Overview
Polyaxon comes with a powerful and customizable visualization system for driving insights in the dashboard or programmatically.
Oftentimes users have advanced use cases that are not supported by the platform, or they need to integrate visualizations generated by external systems.
Polyaxon can consume any chart specification generated by these libraries:
- Matplotlib
- Plotly
- Bokeh
- Altair/Vega
Matplotlib
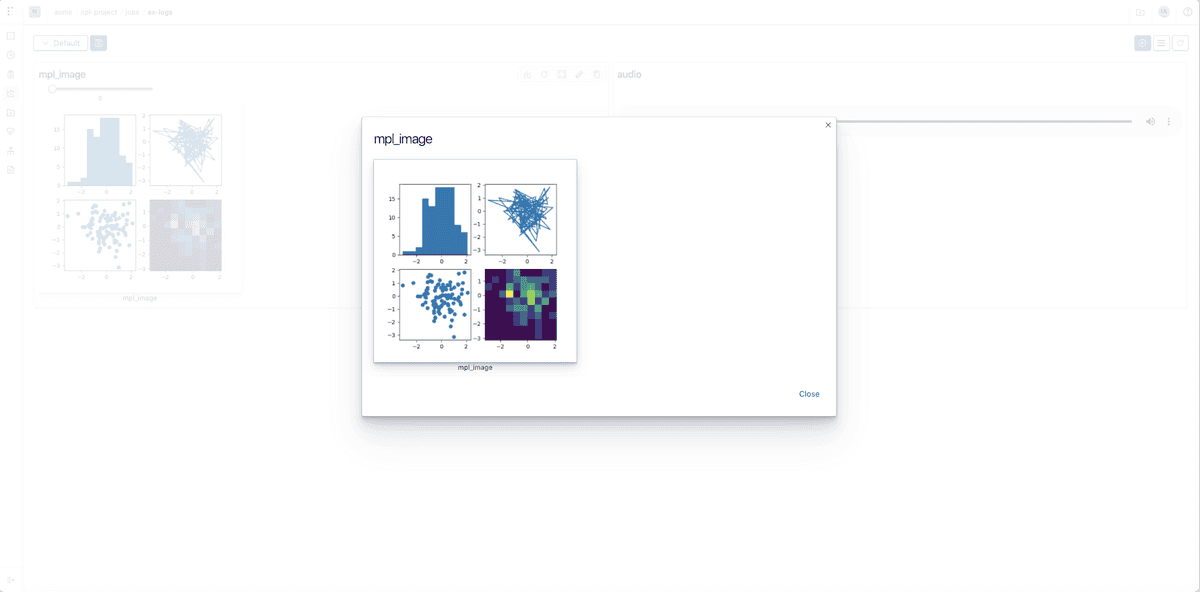
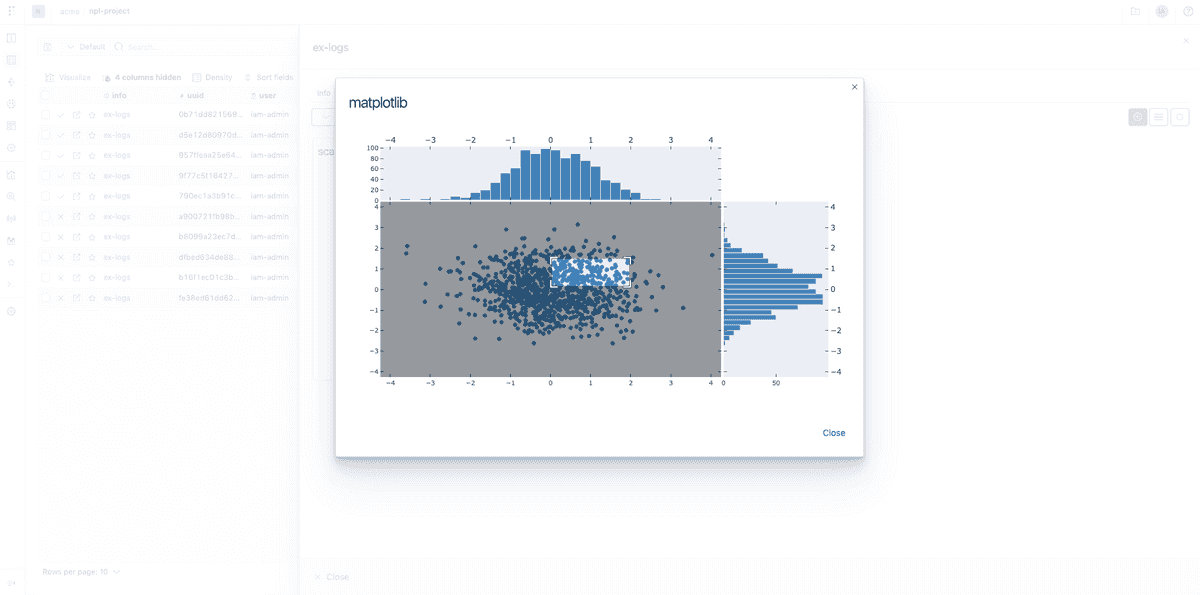
You can log charts generated by Matplotlib directly to Polyaxon.
Polyaxon supports two methods for logging matplotlib figures:
- Logging figures as images
- Parsing the figures to interactive charts
Matplotlib static figures
from polyaxon import tracking

figure = ...

tracking.init(...)

tracking.log_mpl_image(figure, name="my-figure", step=12)
More info about Tracking API
Matplotlib interactive figures
from polyaxon import tracking

figure = ...

tracking.init(...)

tracking.log_mpl_plotly_chart(figure=figure, name="my-figure", step=12)
More info about Tracking API
Plotly
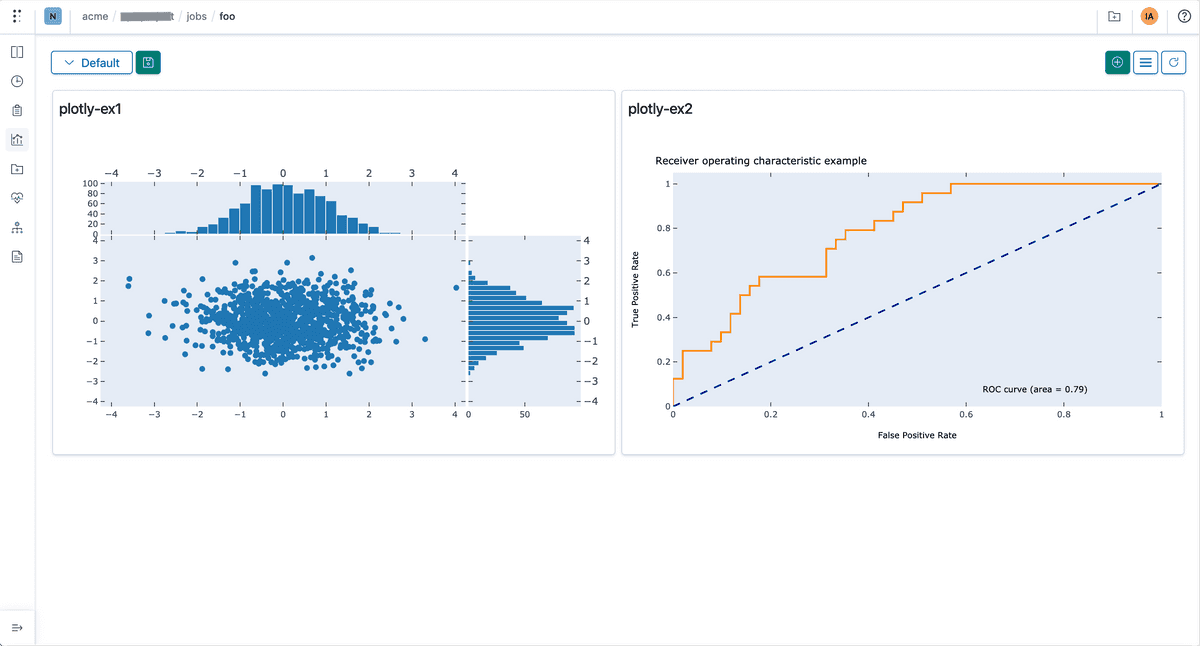
You can log charts generated by Plotly directly to Polyaxon.
from polyaxon import tracking

figure = ...

tracking.init(...)

tracking.log_plotly_chart(figure=figure, name="my-figure", step=12)
More info about Tracking API
Bokeh
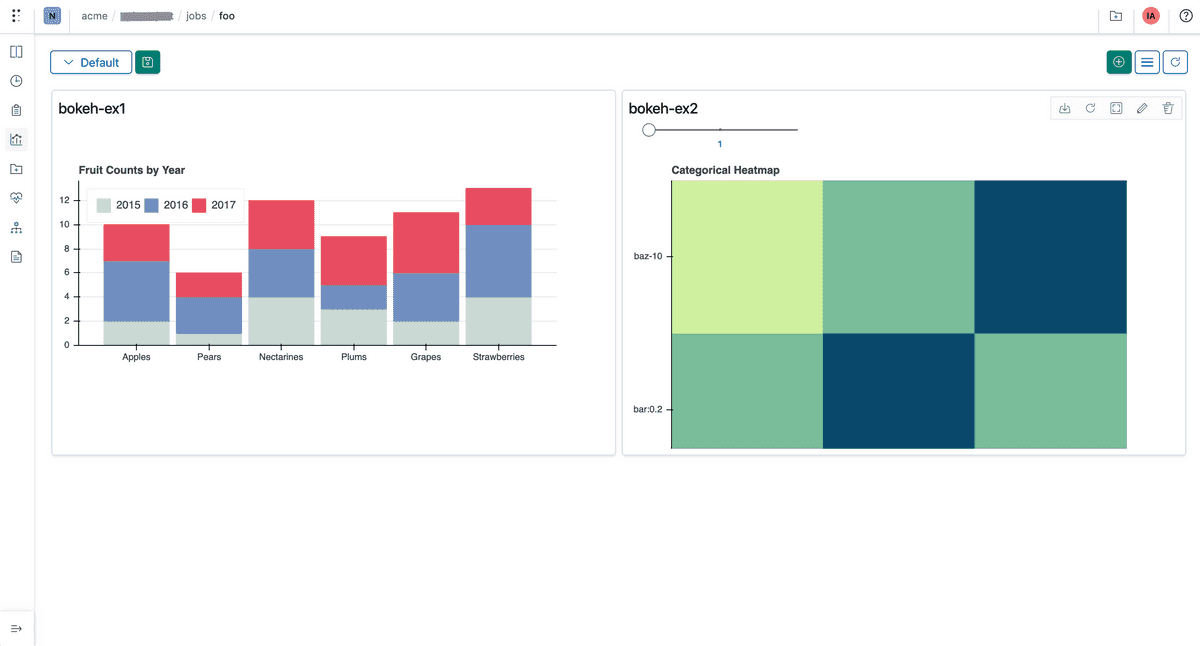
You can log charts generated by Bokeh directly to Polyaxon.
from polyaxon import tracking

figure = ...

tracking.init(...)

tracking.log_bokeh_chart(figure=figure, name="my-figure", step=12)
More info about Tracking API
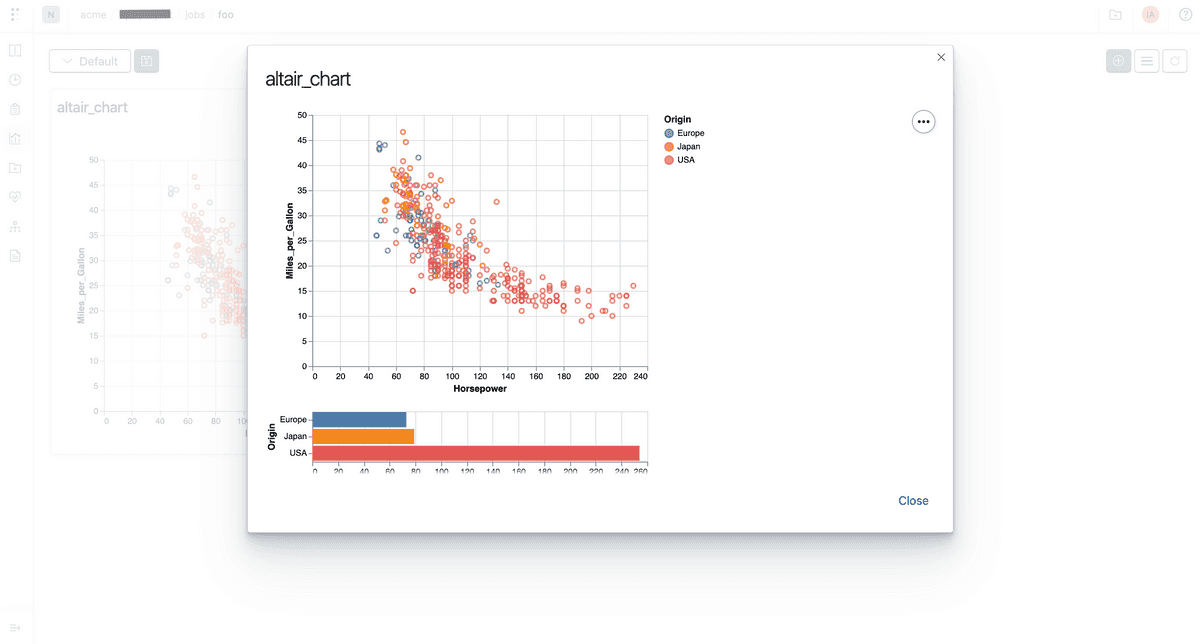
Altair
You can log charts generated by Altair or vega-light directly to Polyaxon
from polyaxon import tracking

figure = ...

tracking.init(...)

tracking.log_altair_chart(figure=figure, name="my-figure", step=12)
More info about Tracking API