Overview
Polyaxon has a programmatic experience for generating visualizations for single runs or multi-run:
Single run
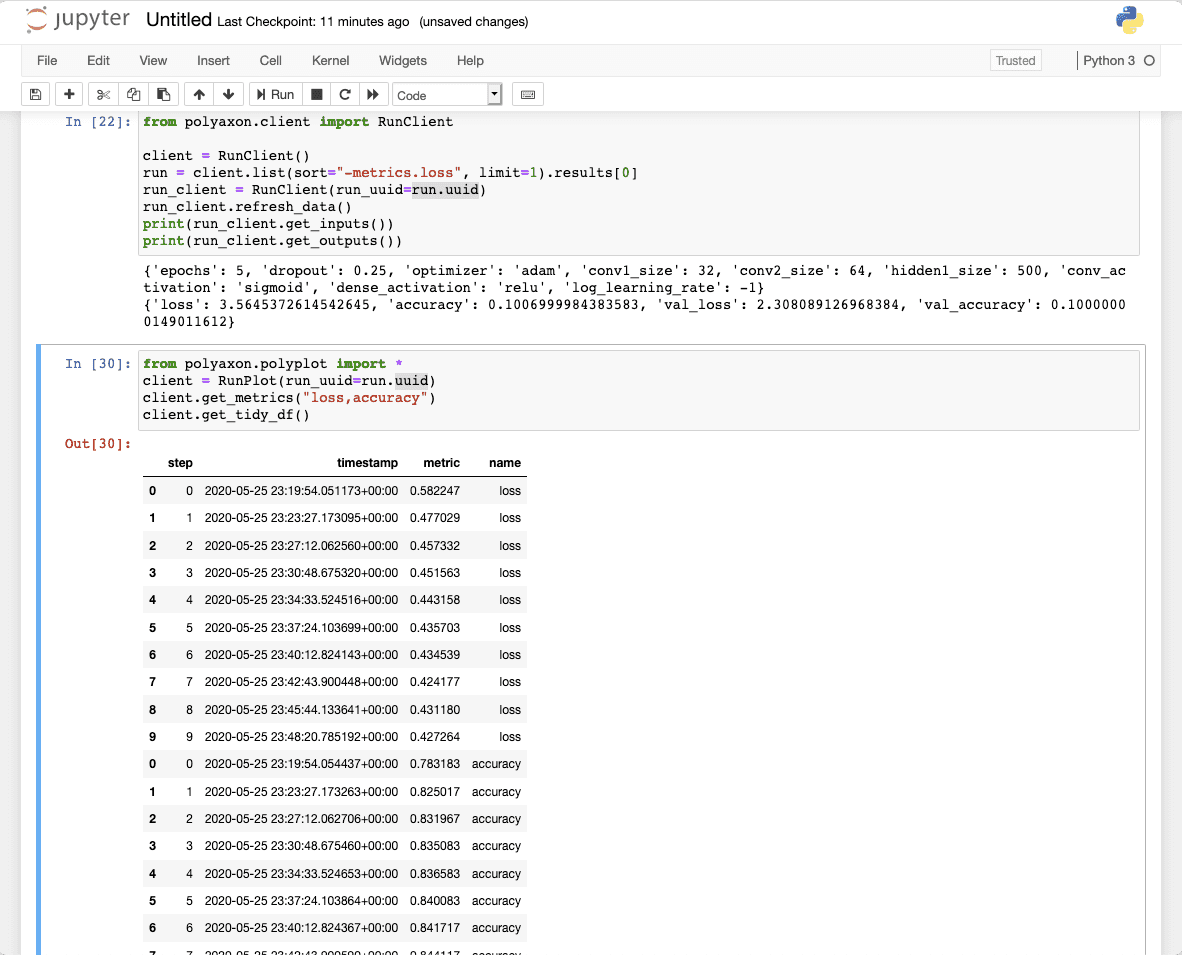
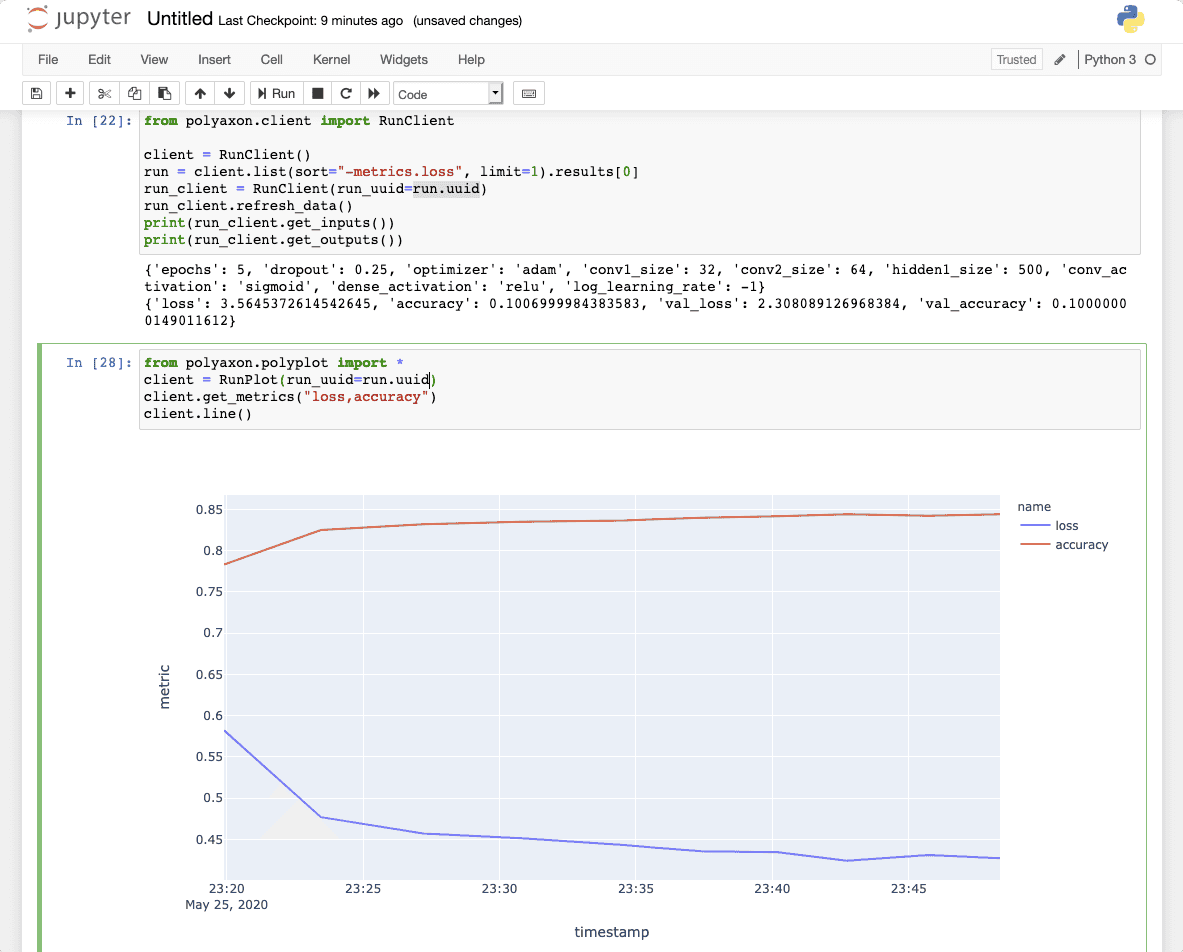
You can use the module Polyplot which requires Plotly express to drive visualizations inside a notebook or jupyter lab.
the module comes with functions to load events, and visualize them:
from polyaxon.client import RunPlot

client = RunPlot(run_uuid="...")
client.get_metrics(names="loss,accuracy")
client.line()
client.bar()
...


HiPlot
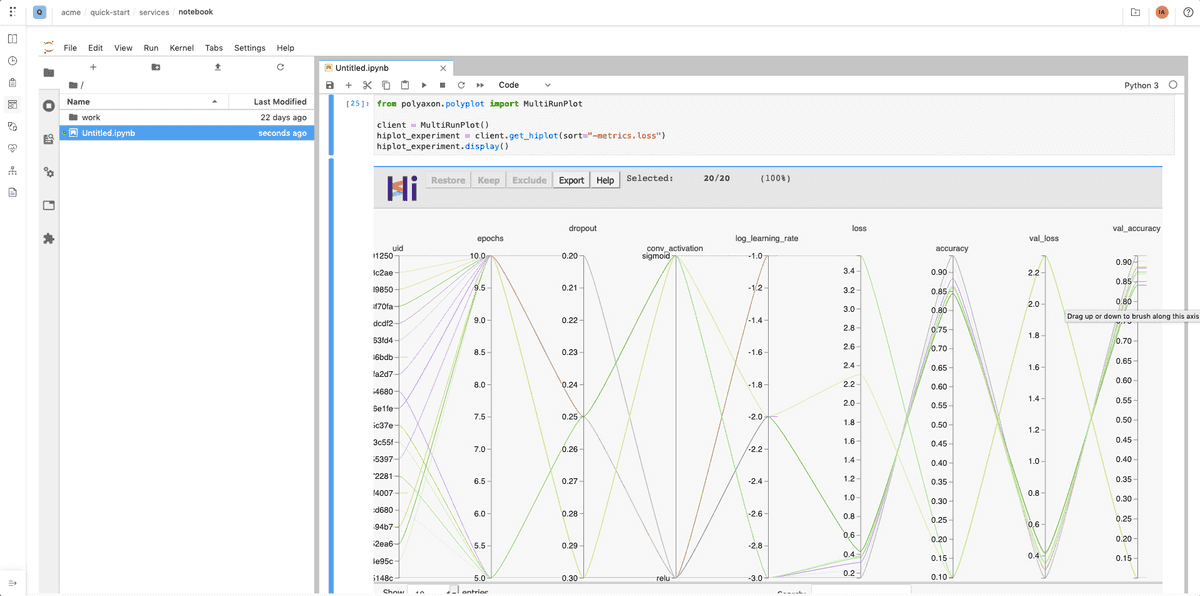
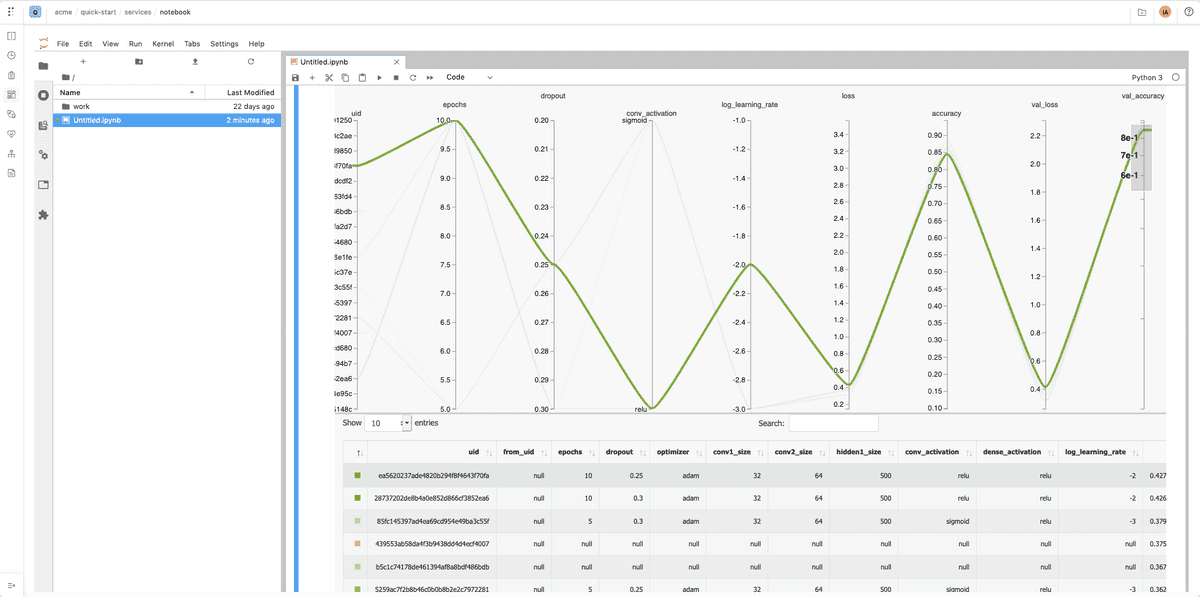
You can use the module MultiRunPlot which requires hiplot to create interactive parallel coordinates inside a notebook or jupyter lab.
from polyaxon.client import RunClient

client = RunClient()
exp = client.get_runs_as_hiplot(query="metrics.loss:<0.1")
exp.display()

