More Visual Control
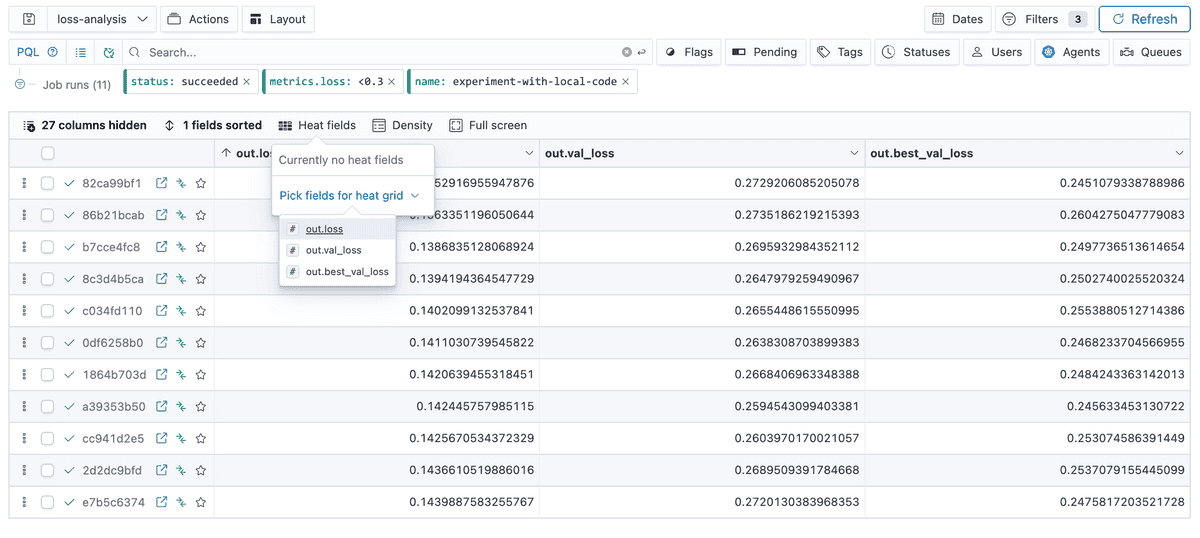
With the runs table, you can view the metrics, params and other metadata in an interactive GUI that displays the tabular data in a beautiful way.
Anyone that has used spreadsheet software like Excel may notice additional familiar features, like quick resize of columns, sorting by columns, showing/hiding columns, cells expansion, and columns formatting (Polyaxon UI automatically detects and converts columns to the scalar, Json, currency, percentage, and date formats automatically). These emphasize our commitment to making the experience as intuitive as possible for users.
In this release we are adding yet another feature: heatmaps.
Creating Heatmap
With Polyaxon v1.13, users have a new options to compare runs’ metrics and parameters by turning the columns to a heatmap.
-
Adding a heat field
-
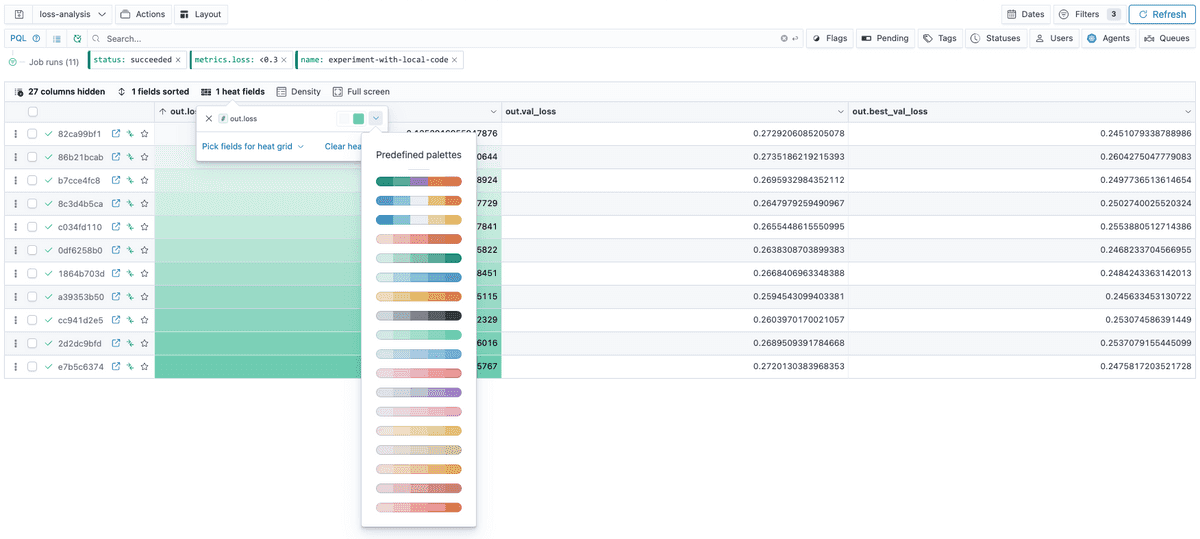
Changing the default palette
-
Adding more fields
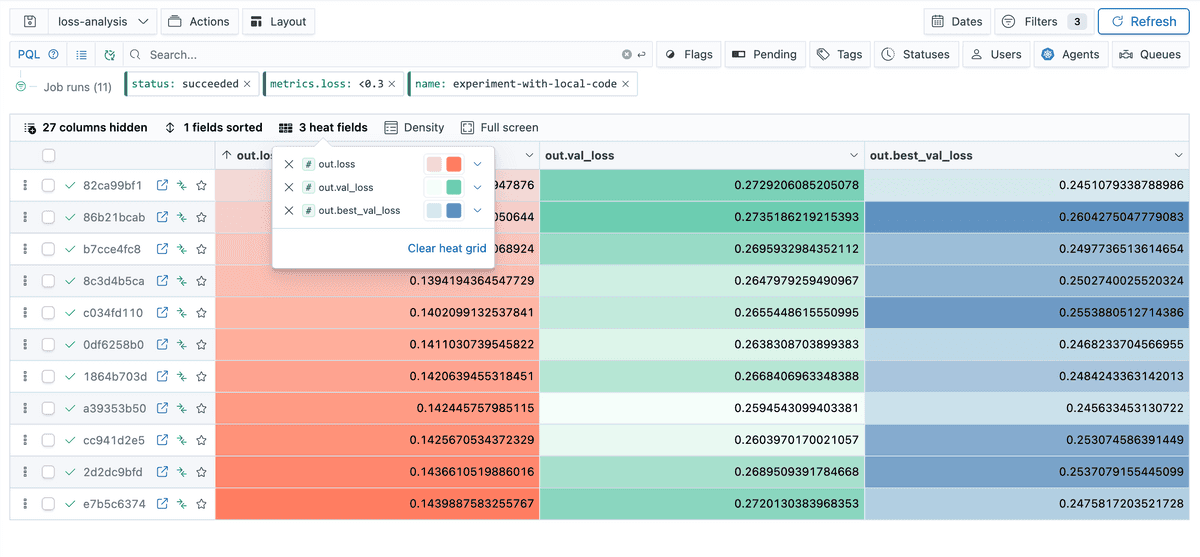
-
Adding categorical fields
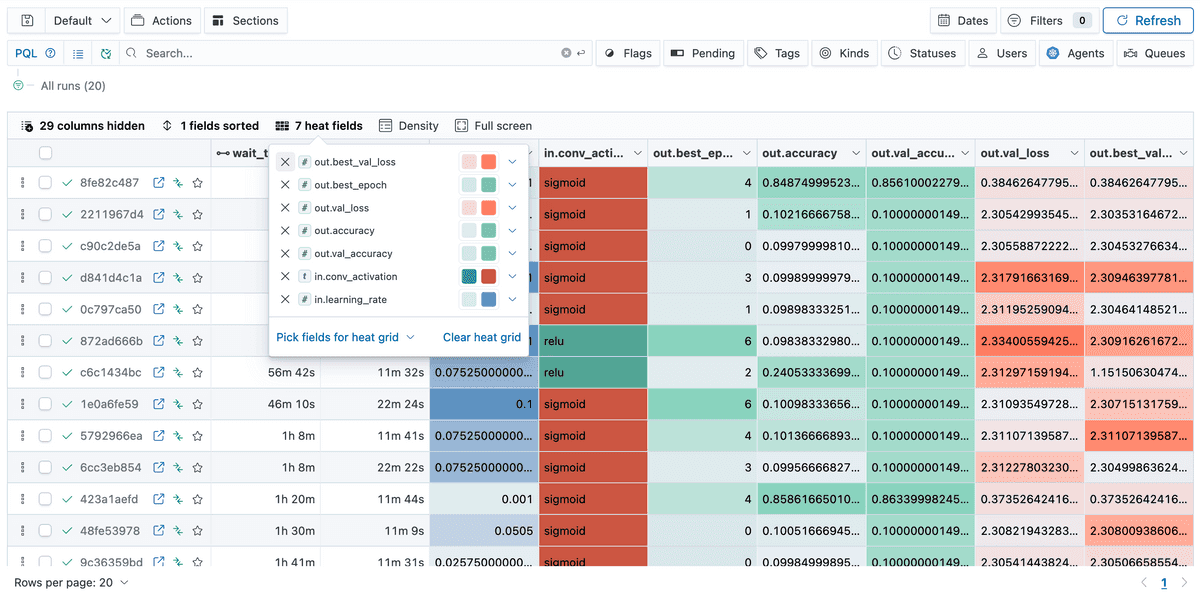
Learn More about Polyaxon
This blog post just goes over a couple of features that we shipped in v1.13. To learn more about all the features, fixes, and enhancements, please visit the release notes and the short term roadmap.
Polyaxon continues to grow quickly and keeps improving and providing the simplest machine learning abstraction. We hope that these updates will improve your workflows and increase your productivity, and again, thank you for your continued feedback and support.

