Overview
The comparison view is a powerful tool for listing, filtering, sorting, rearranging, and comparing runs.
Features
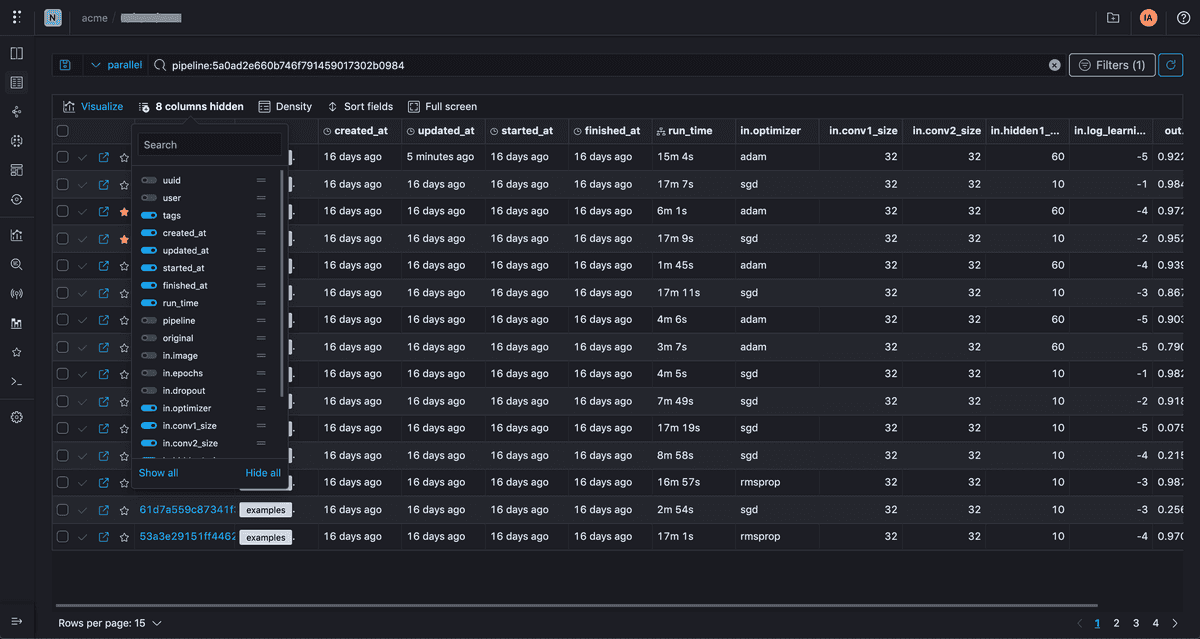
You can control the columns to show or hide on the table, you can control their order, and the width of each column:
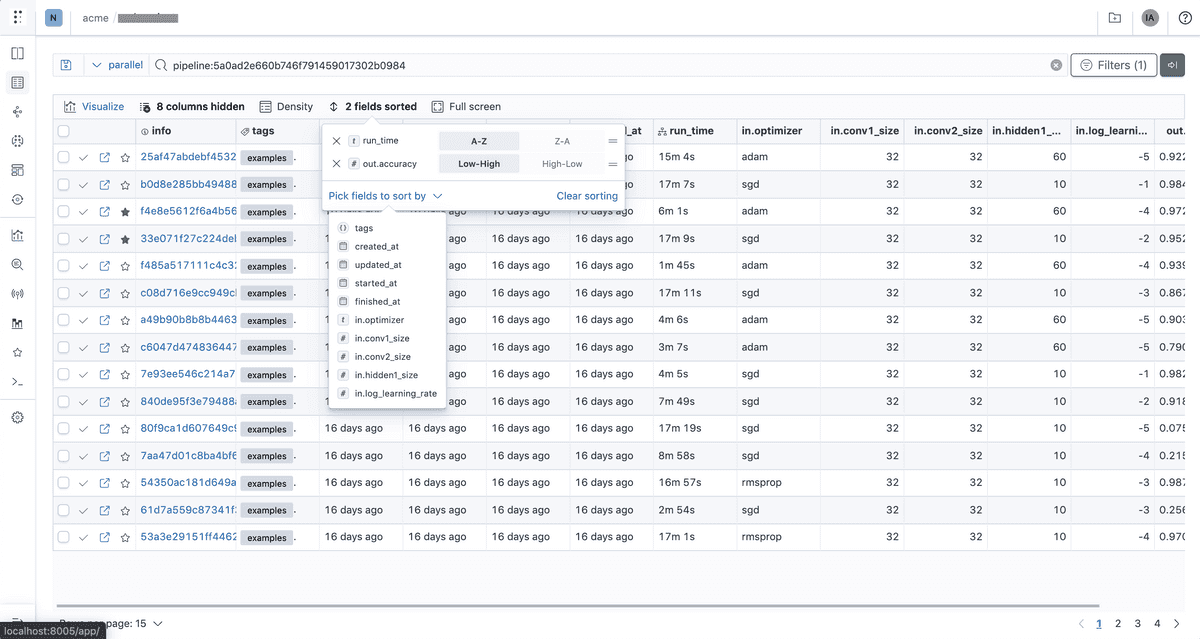
You can filter and sort by many columns:
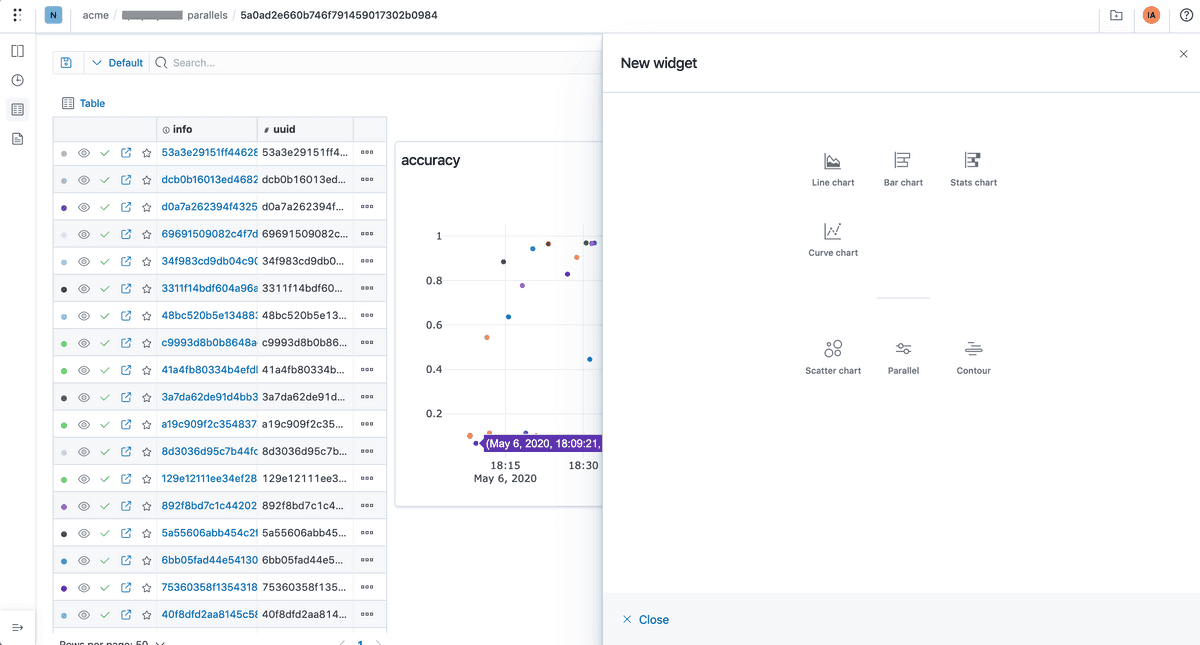
For runs with metrics, you can switch to a visualization mode to compare metrics charts, curve charts:
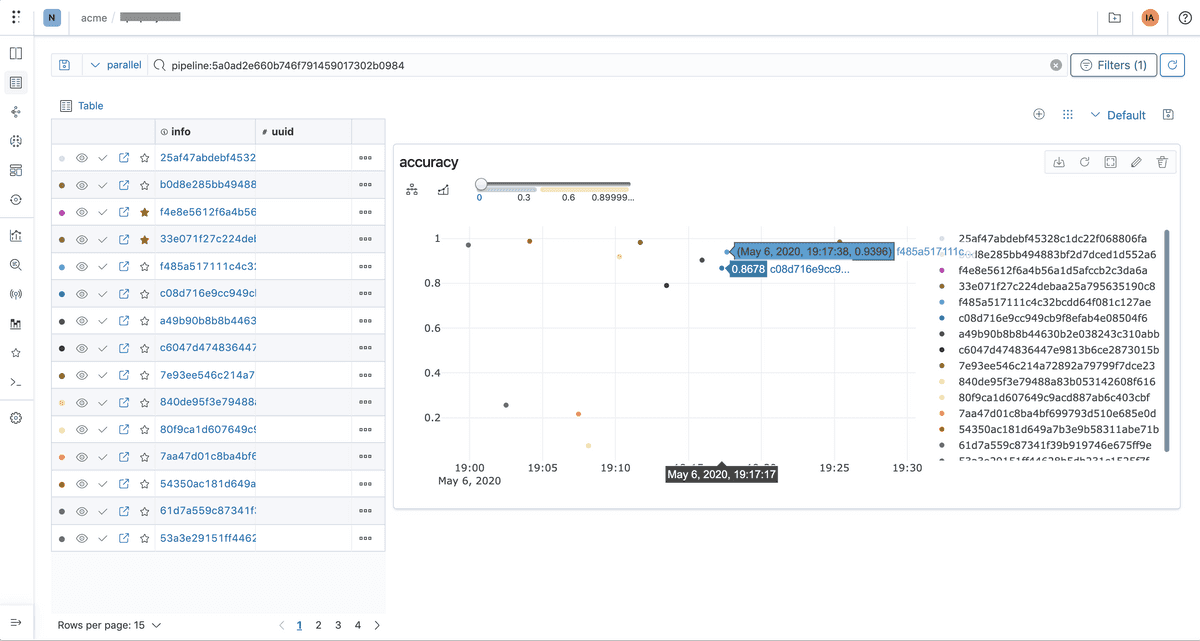
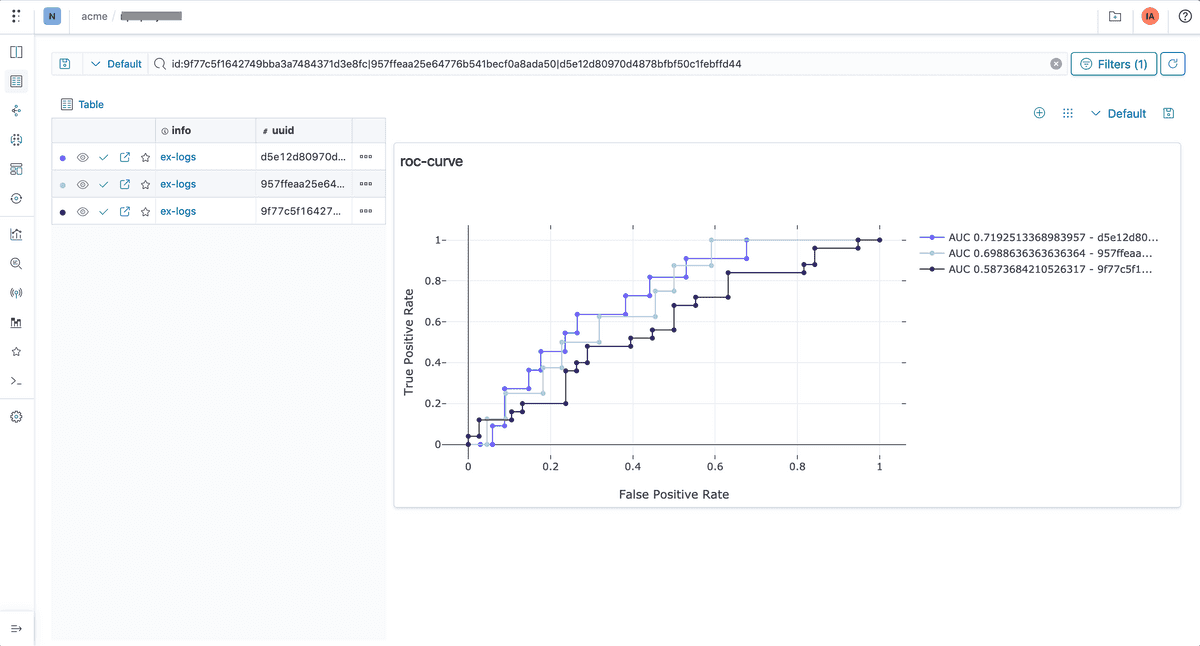
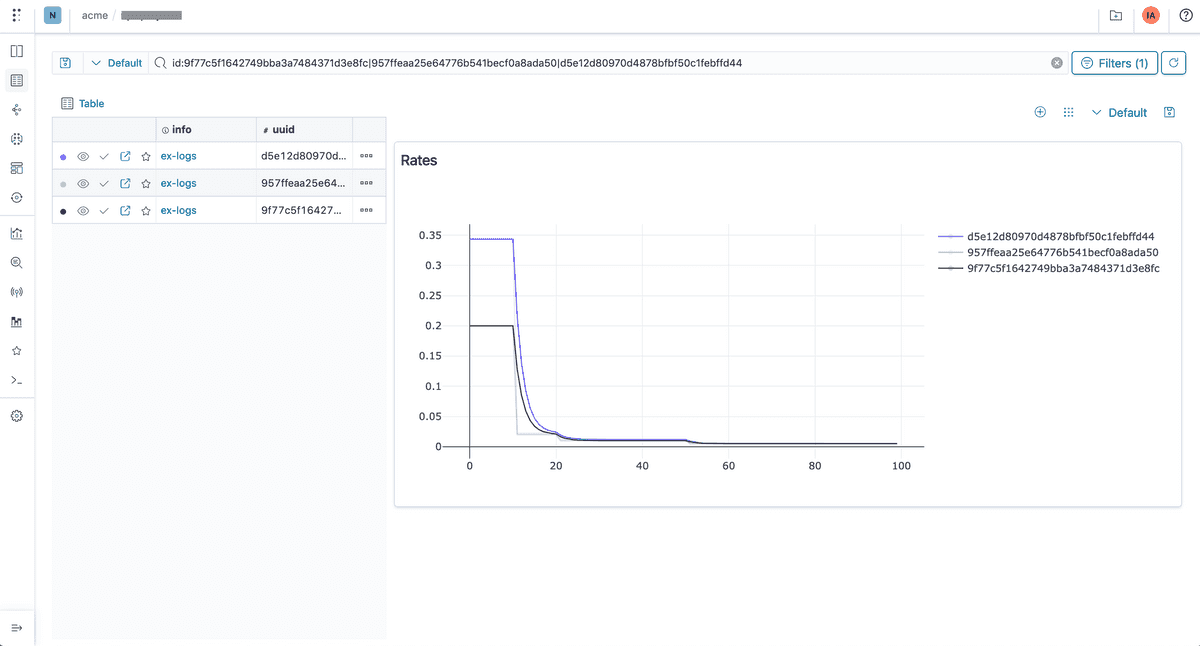
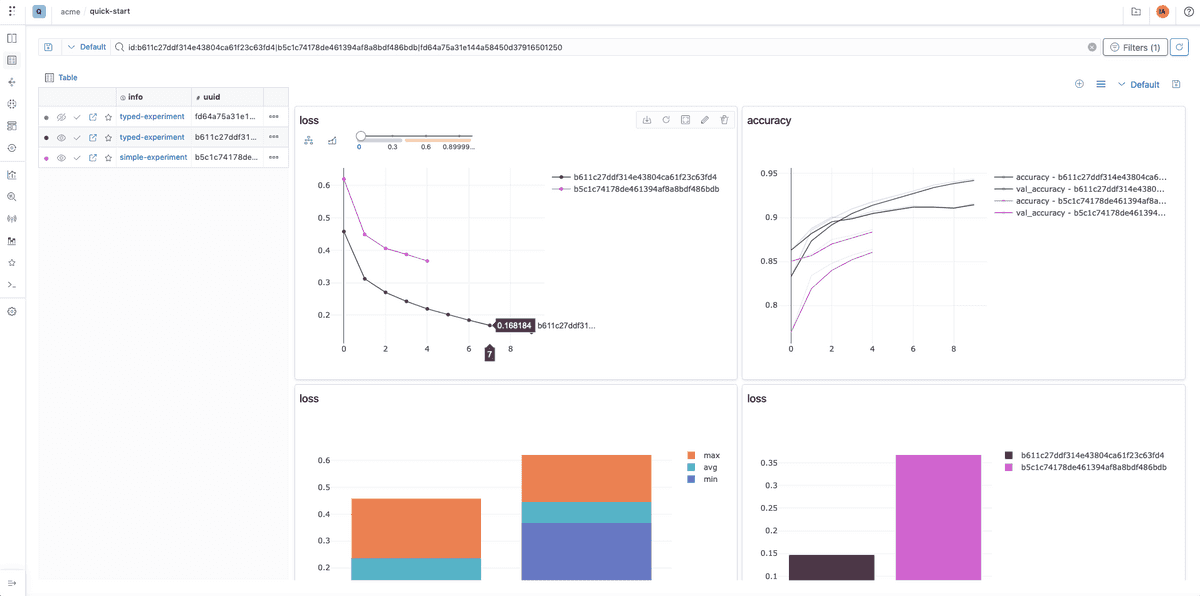
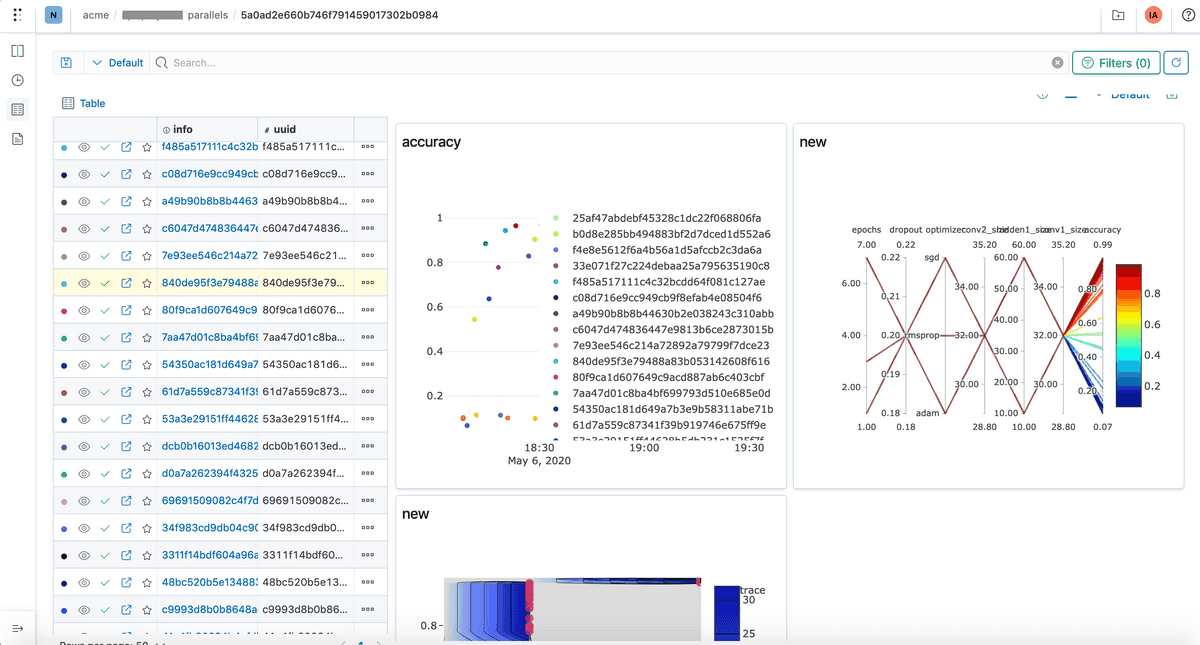

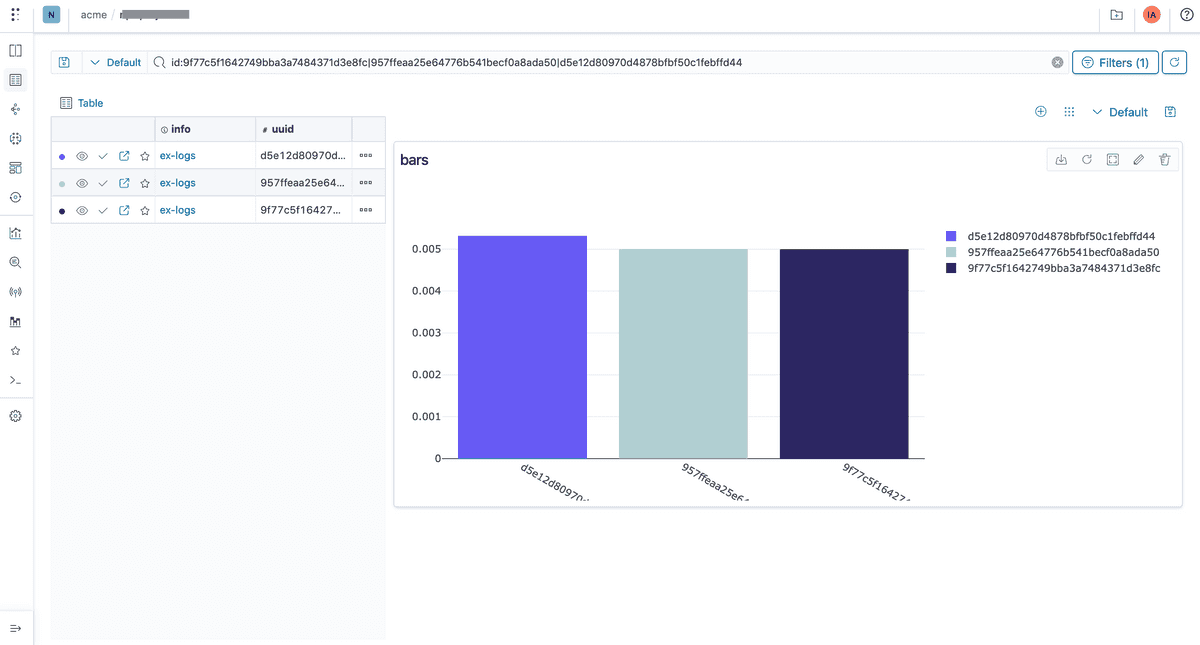
The comparison features are also useful to create charts for hyperparameter tuning or a selection of runs to create hyperparameter values and model metrics charts
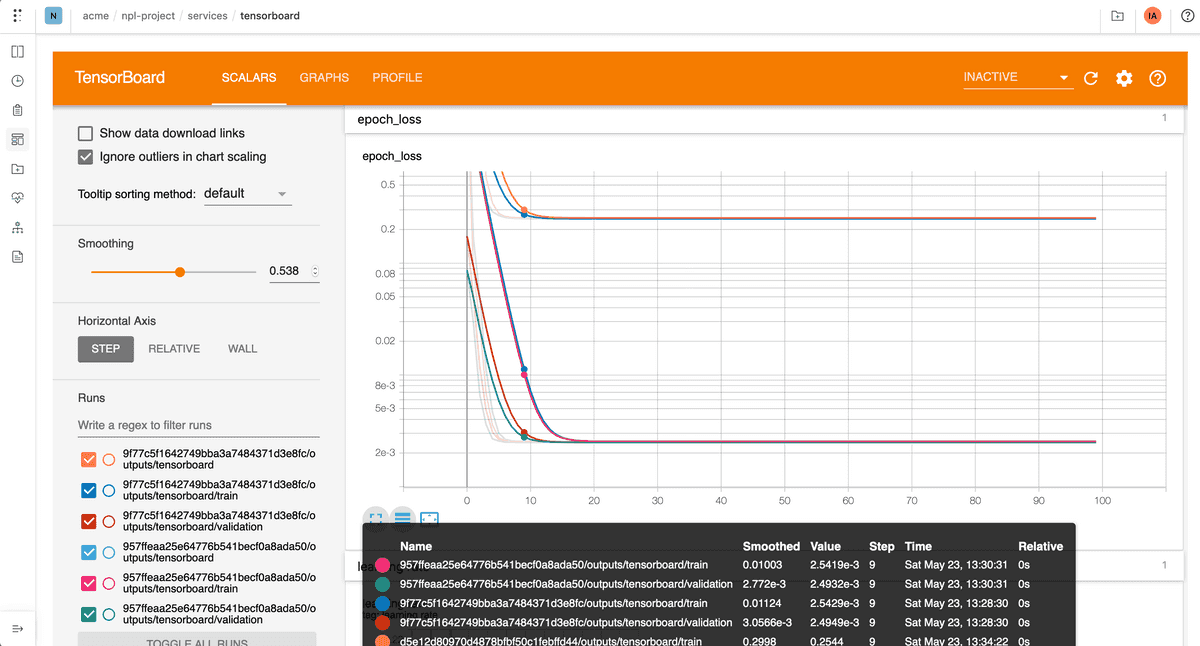
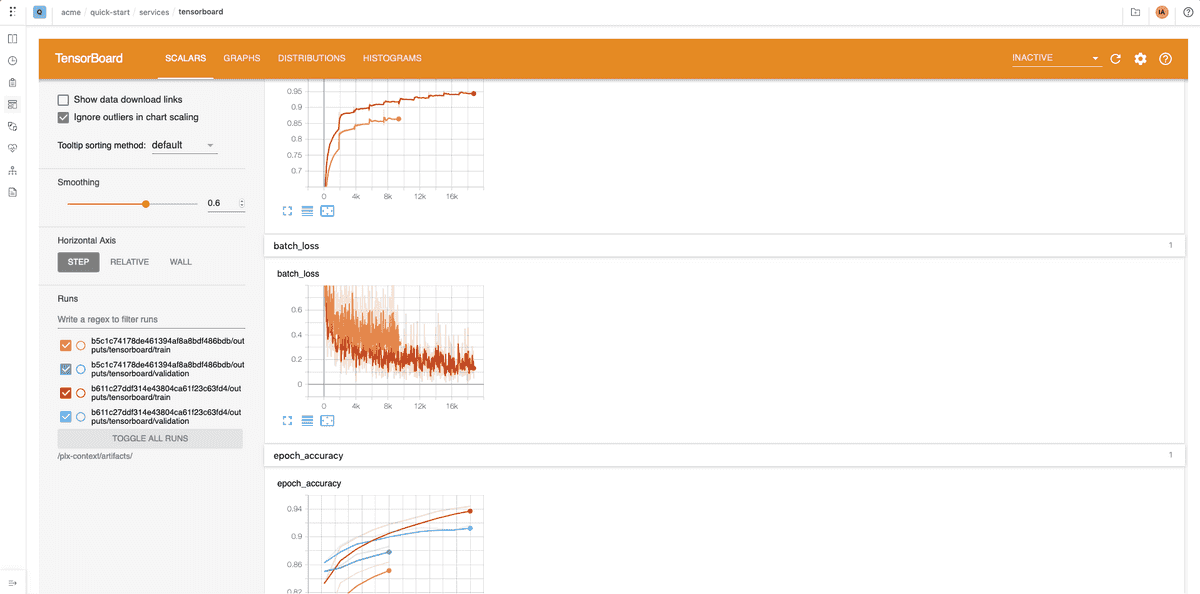
And compare runs on Tensorboard
