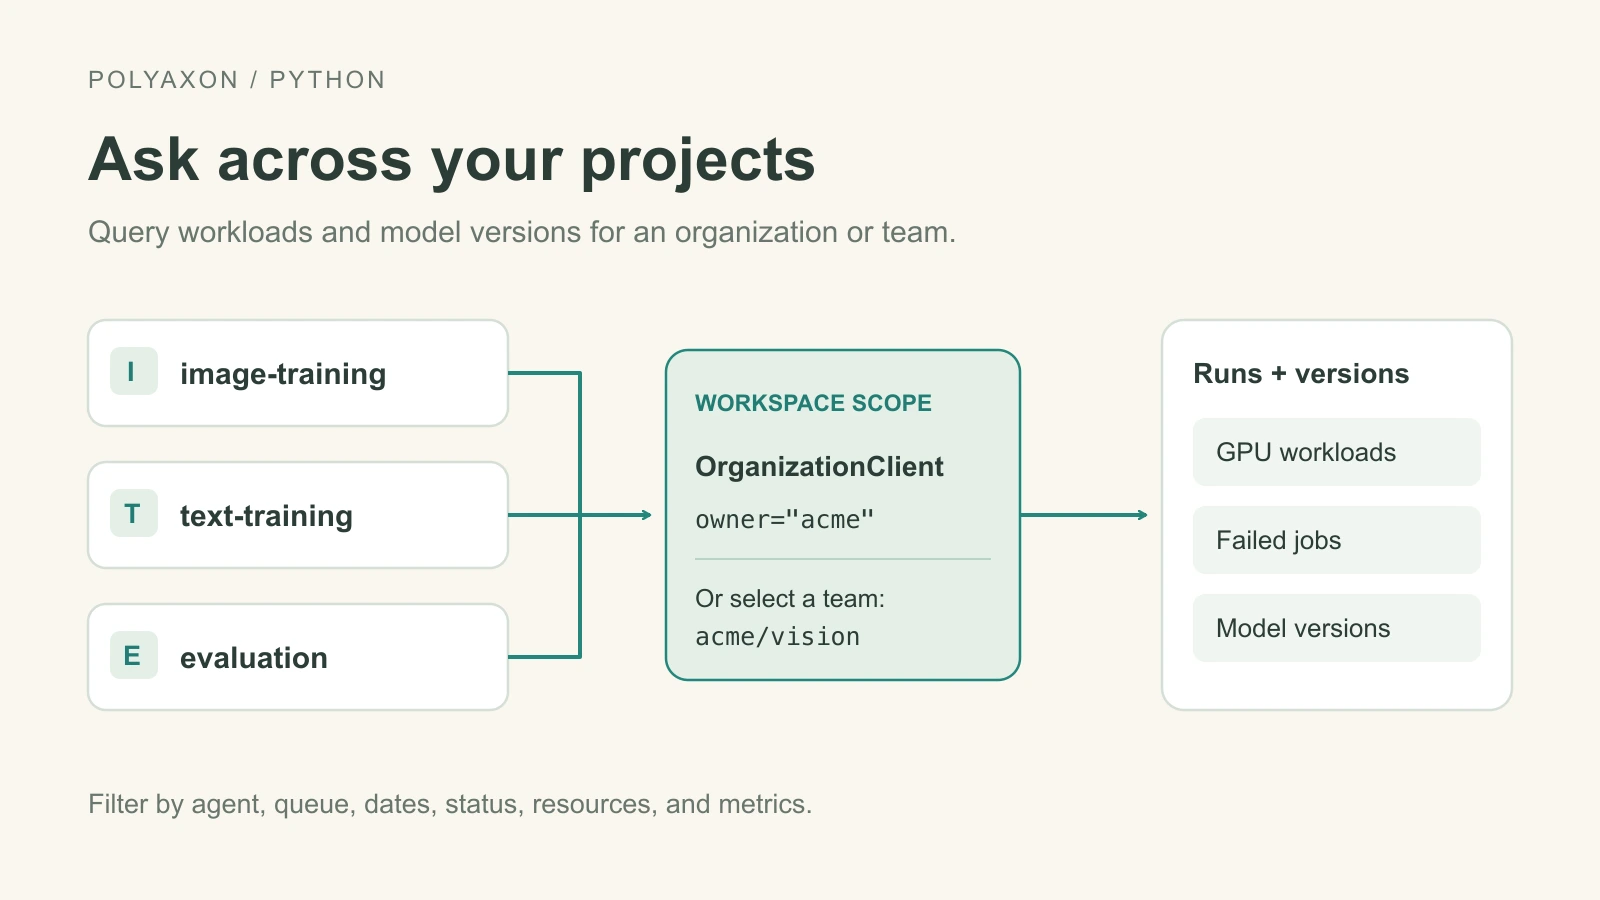
Query runs and model versions across projects
Use Polyaxon's organization and team APIs to inspect GPU workloads by agent, count model versions, and calculate job failure rates across projects.
PolyaxonPythonMonitoring
The latest guides, tutorials, and product updates.
Use Polyaxon's organization and team APIs to inspect GPU workloads by agent, count model versions, and calculate job failure rates across projects.
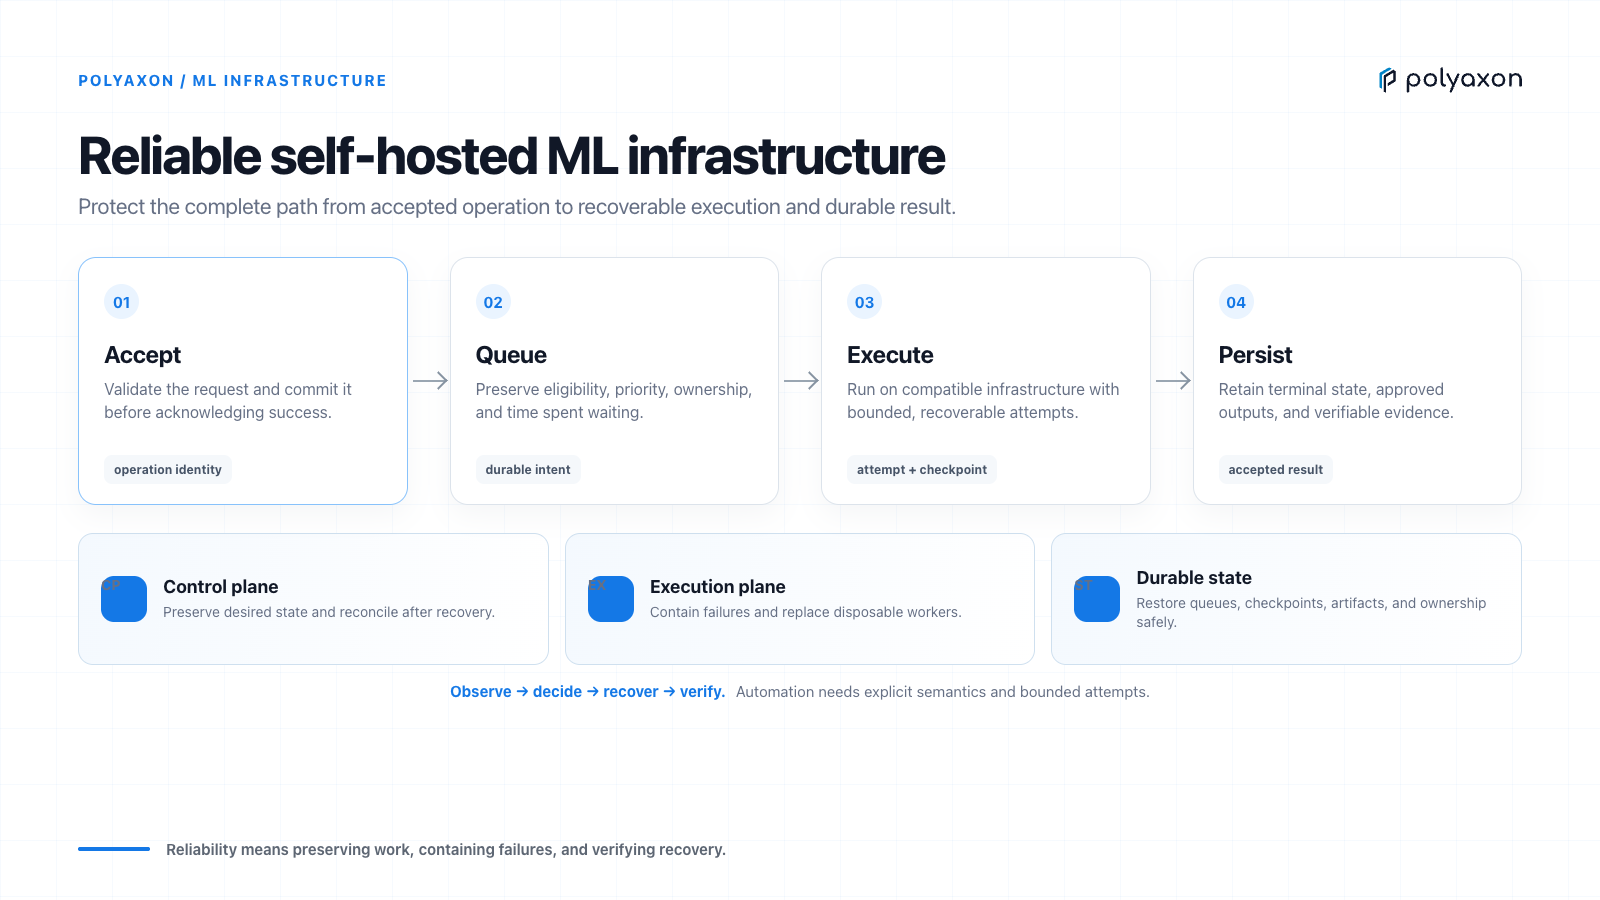
Build self-hosted ML infrastructure around explicit failure domains, durable queues and artifacts, eligible failover, actionable telemetry, and tested recovery.
Use custom metrics with Kubernetes HPA for independent inference replicas, account for model startup, and distinguish desired replicas from usable capacity.
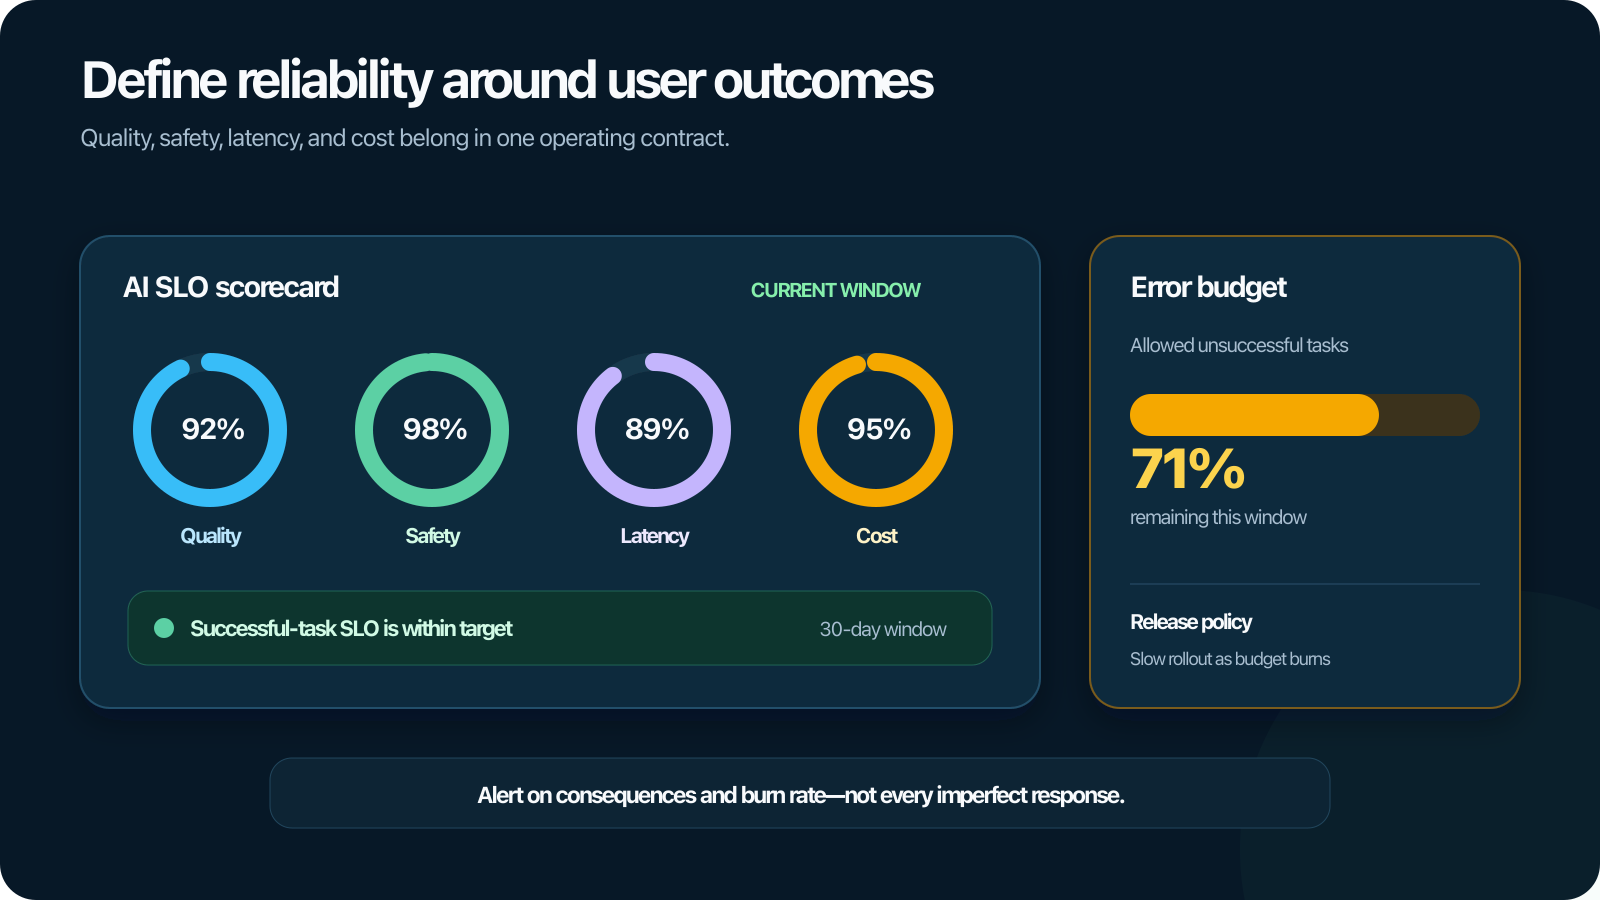
Define service-level objectives for AI quality, task success, safety, latency, availability, and cost using measurable user-centered indicators.
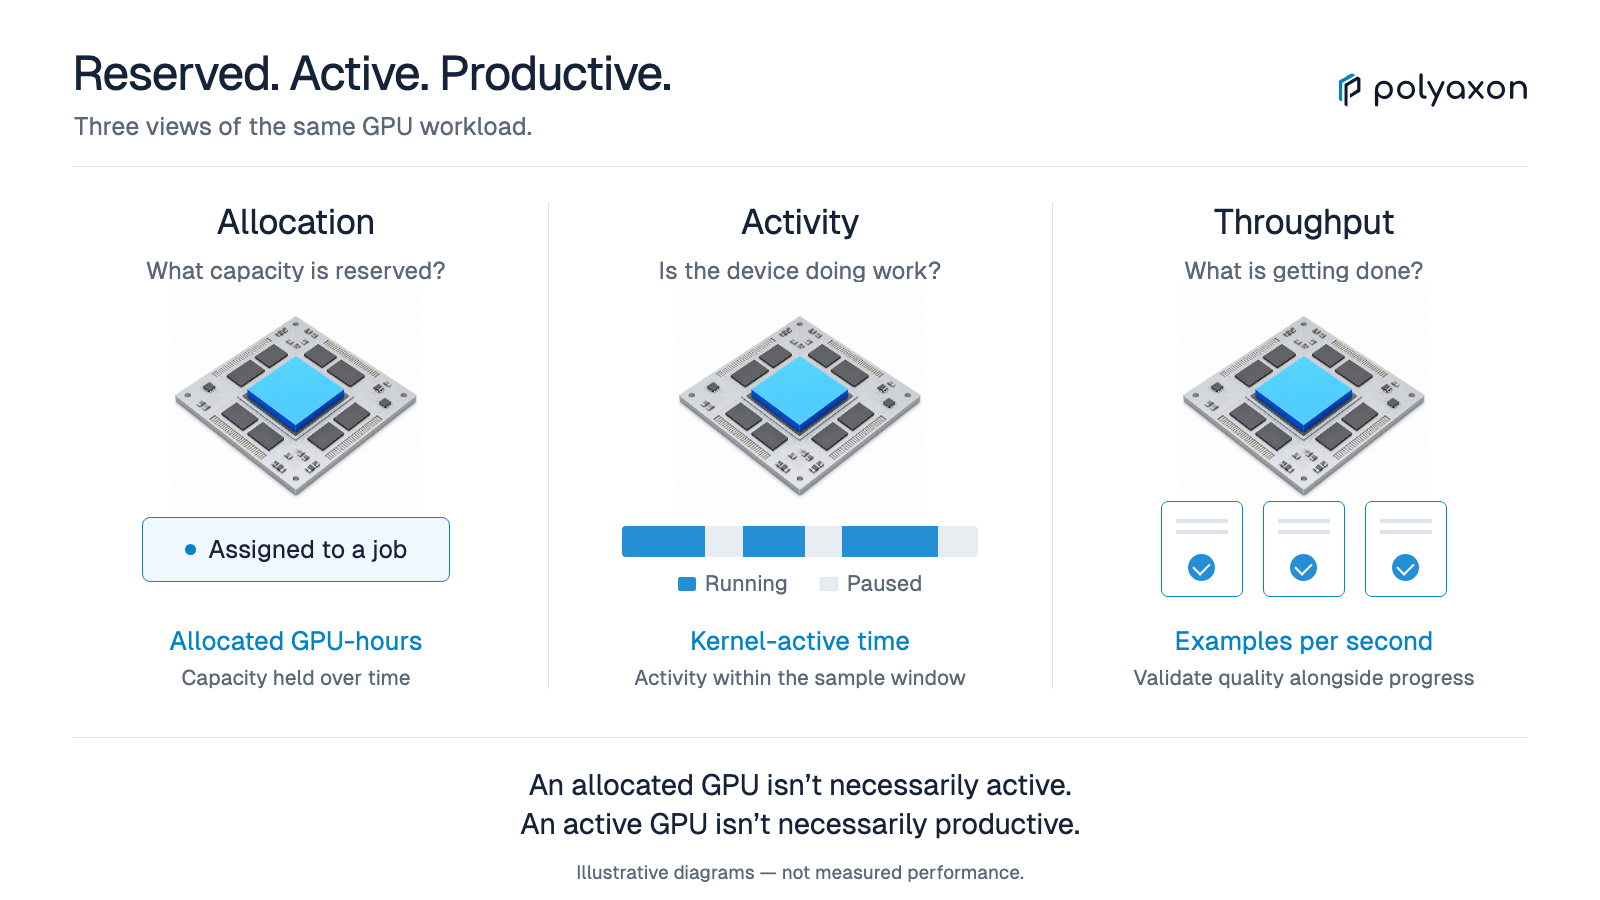
Learn which GPU utilization metrics explain capacity, device activity, memory pressure, and useful ML throughput—and how to avoid misleading averages.
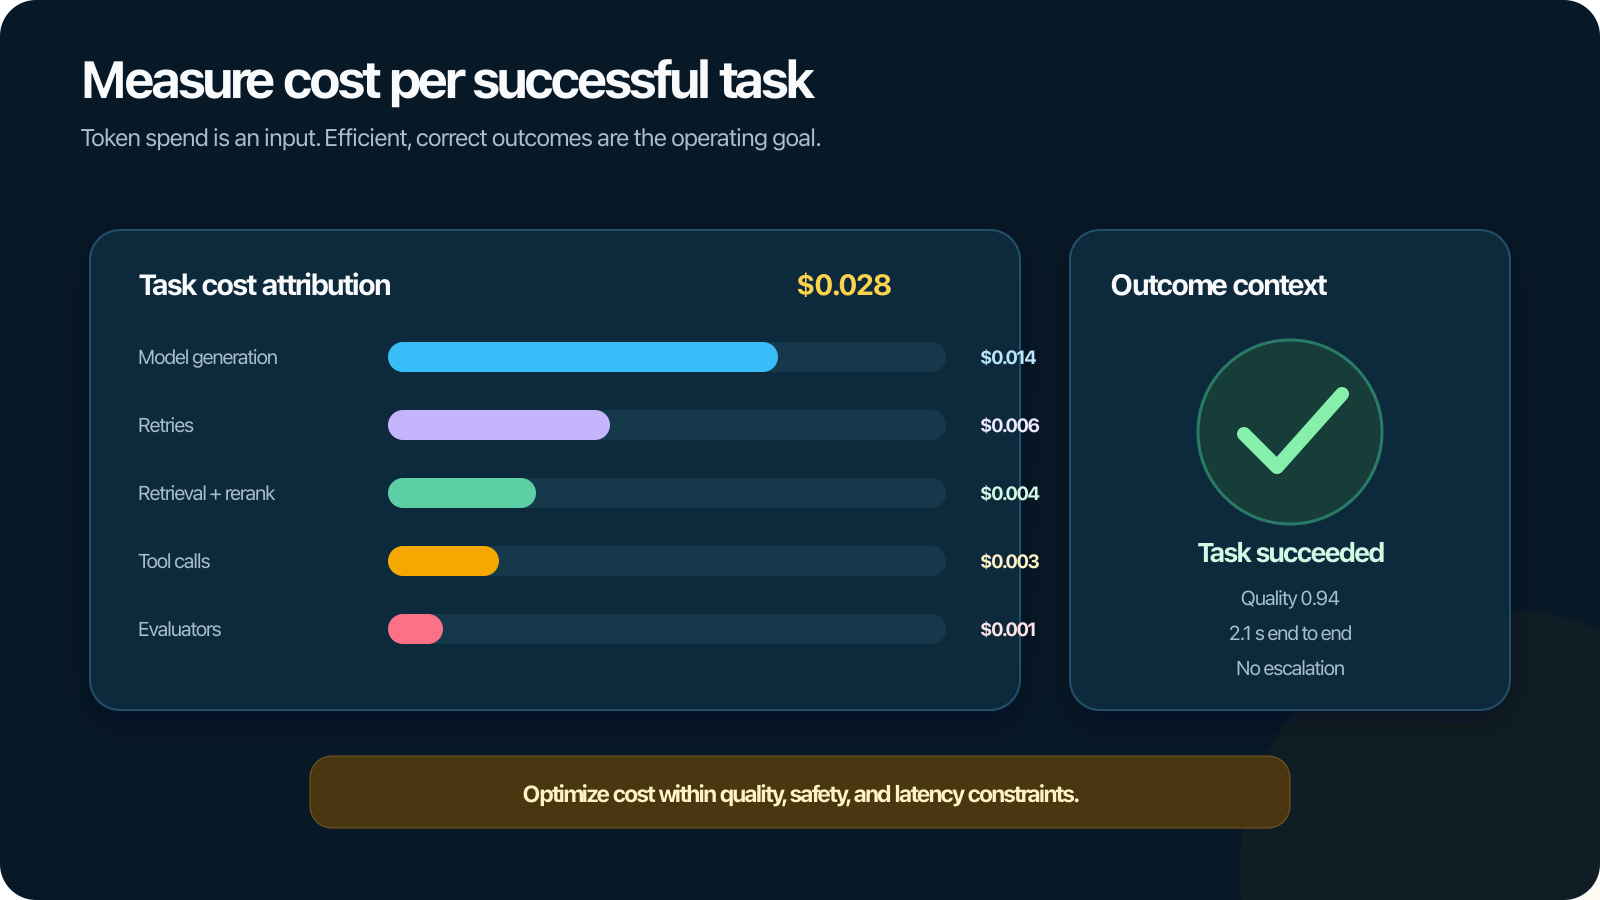
Connect tokens, model calls, retrieval, tools, retries, and infrastructure with quality and task outcomes to control production LLM costs.
Configure startup, readiness, and liveness probes for model servers and interactive ML services without causing restart loops or hiding dependency failures.
Design repeatable Kubernetes load tests for model services using realistic arrivals, tail latency, queueing, accelerator metrics, and recovery criteria.
Give model servers enough time to load weights and warm runtimes without weakening liveness detection for the rest of their lifecycle.
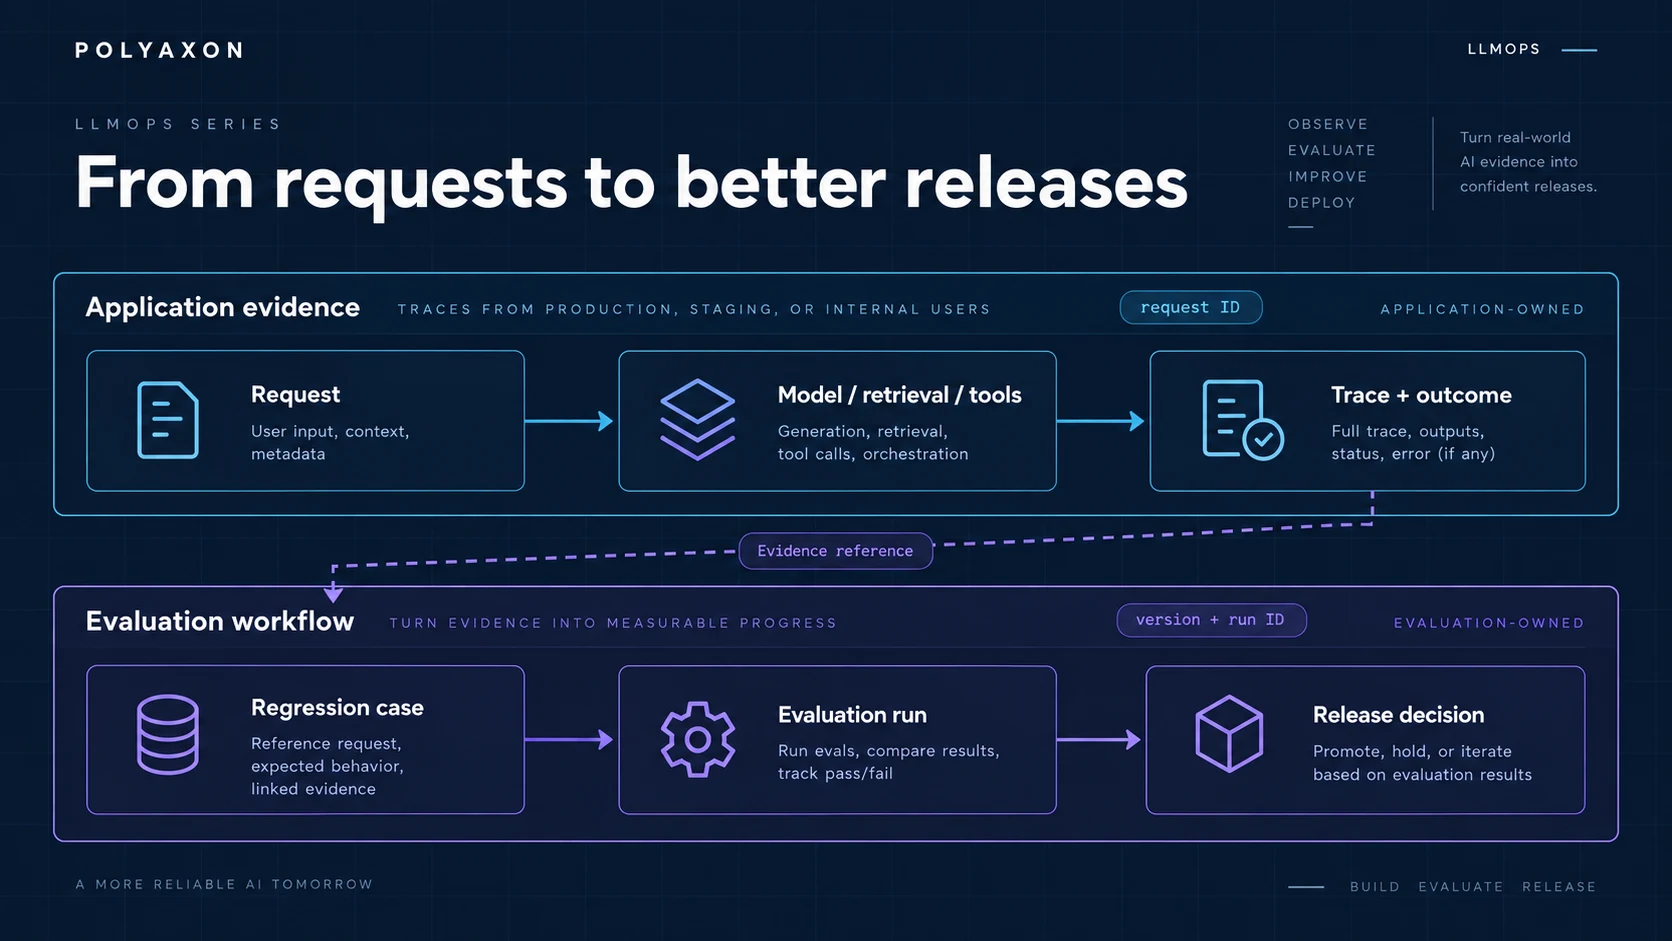
AI observability connects traces, metrics, evaluations, feedback, and runtime context so teams can understand and improve models, applications, and agents.
Diagnose Kubernetes DiskPressure, understand eviction signals, and prevent images, logs, and local ML data from exhausting node storage.
Configure Django logs for container collection, useful request context, exception diagnosis, privacy, and correlation with Kubernetes workload state.
Monitor Node.js services with request outcomes, event-loop delay, memory, dependencies, Kubernetes state, and low-cardinality telemetry.
Create useful Python logs for training and batch workloads with structured context, exception details, stdout collection, and controlled volume.
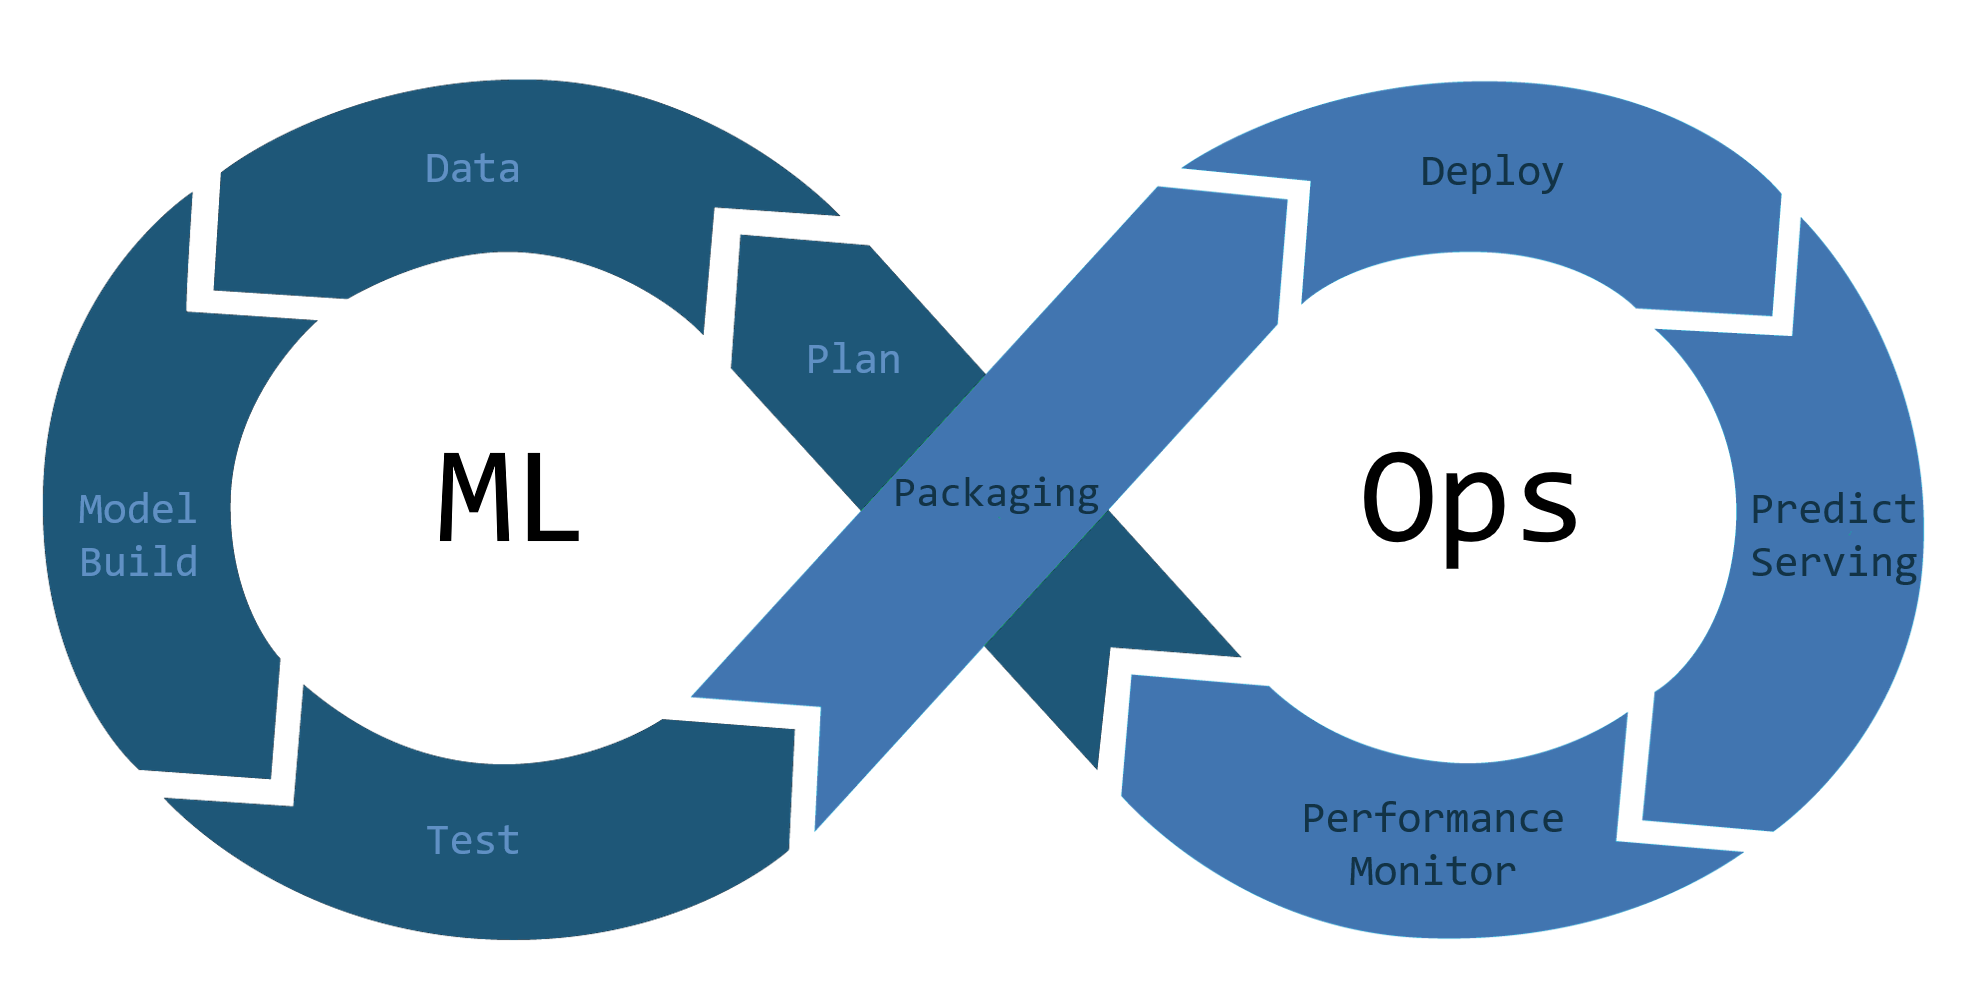
ML observability connects logs, metrics, artifacts, infrastructure signals, and model behavior so teams can debug training and serving systems.
Monitor Kubernetes object state for ML workloads while separating desired state, resource usage, application outcomes, and high-cardinality metadata.
Design Kubernetes audit policy, collection, retention, and investigation workflows for shared ML clusters without recording sensitive payloads by default.
Connect Django request outcomes, database and cache health, worker behavior, Kubernetes state, and release context in one monitoring strategy.
Design container logs for local Docker debugging and Kubernetes collection without losing run context, exhausting nodes, or exposing sensitive data.
Design OpenTelemetry Collector pipelines for ML services with clear receivers, processors, exporters, deployment patterns, and failure controls.
Build layered Amazon EKS monitoring for control-plane activity, Kubernetes state, nodes, GPUs, applications, ML runs, and telemetry health.
Design Prometheus alerts and Alertmanager routing for ML platforms without noisy pages, missing owners, or unsafe high-cardinality labels.
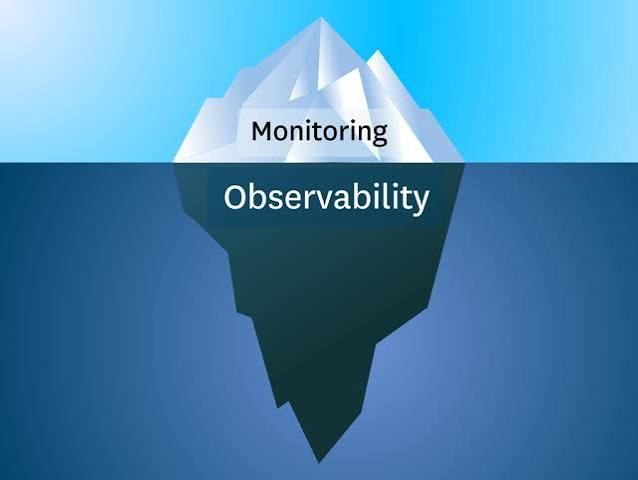
Separate monitoring from observability, then combine metrics, logs, traces, run context, and model evaluation into an effective ML operating model.
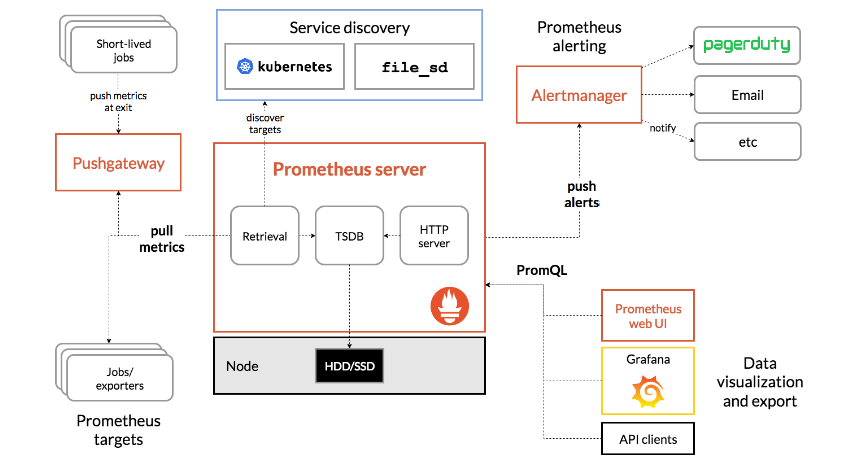
Decide between managed and self-operated Prometheus using scale, availability, PromQL compatibility, data governance, cost, and operational ownership.