
BTF for portable eBPF observability
Understand how BPF Type Format supports eBPF introspection, CO-RE portability, safer deployment, and kernel-level observability for ML infrastructure.
KubernetesObservabilityMonitoring
Page 2 of 2
Understand how BPF Type Format supports eBPF introspection, CO-RE portability, safer deployment, and kernel-level observability for ML infrastructure.
Use OpenTelemetry automatic instrumentation as a safe baseline, then add domain spans, stable attributes, sampling, and rollout controls for ML services.
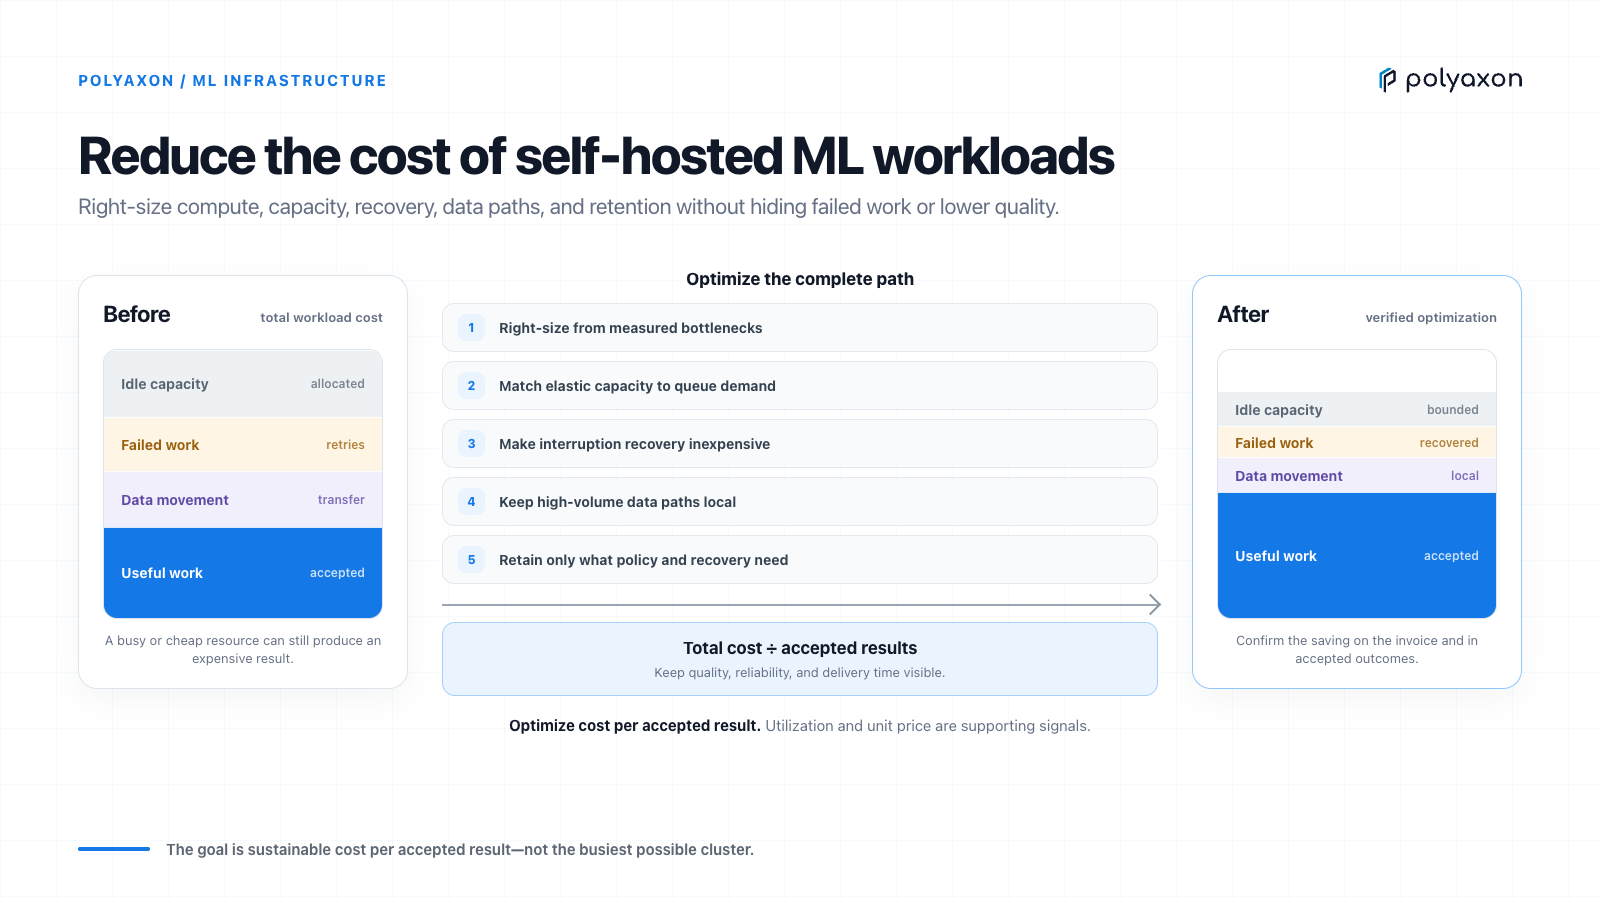
Allocate Kubernetes and GPU costs to ML teams and runs while keeping idle capacity, shared services, failed work, data movement, and useful outcomes visible.
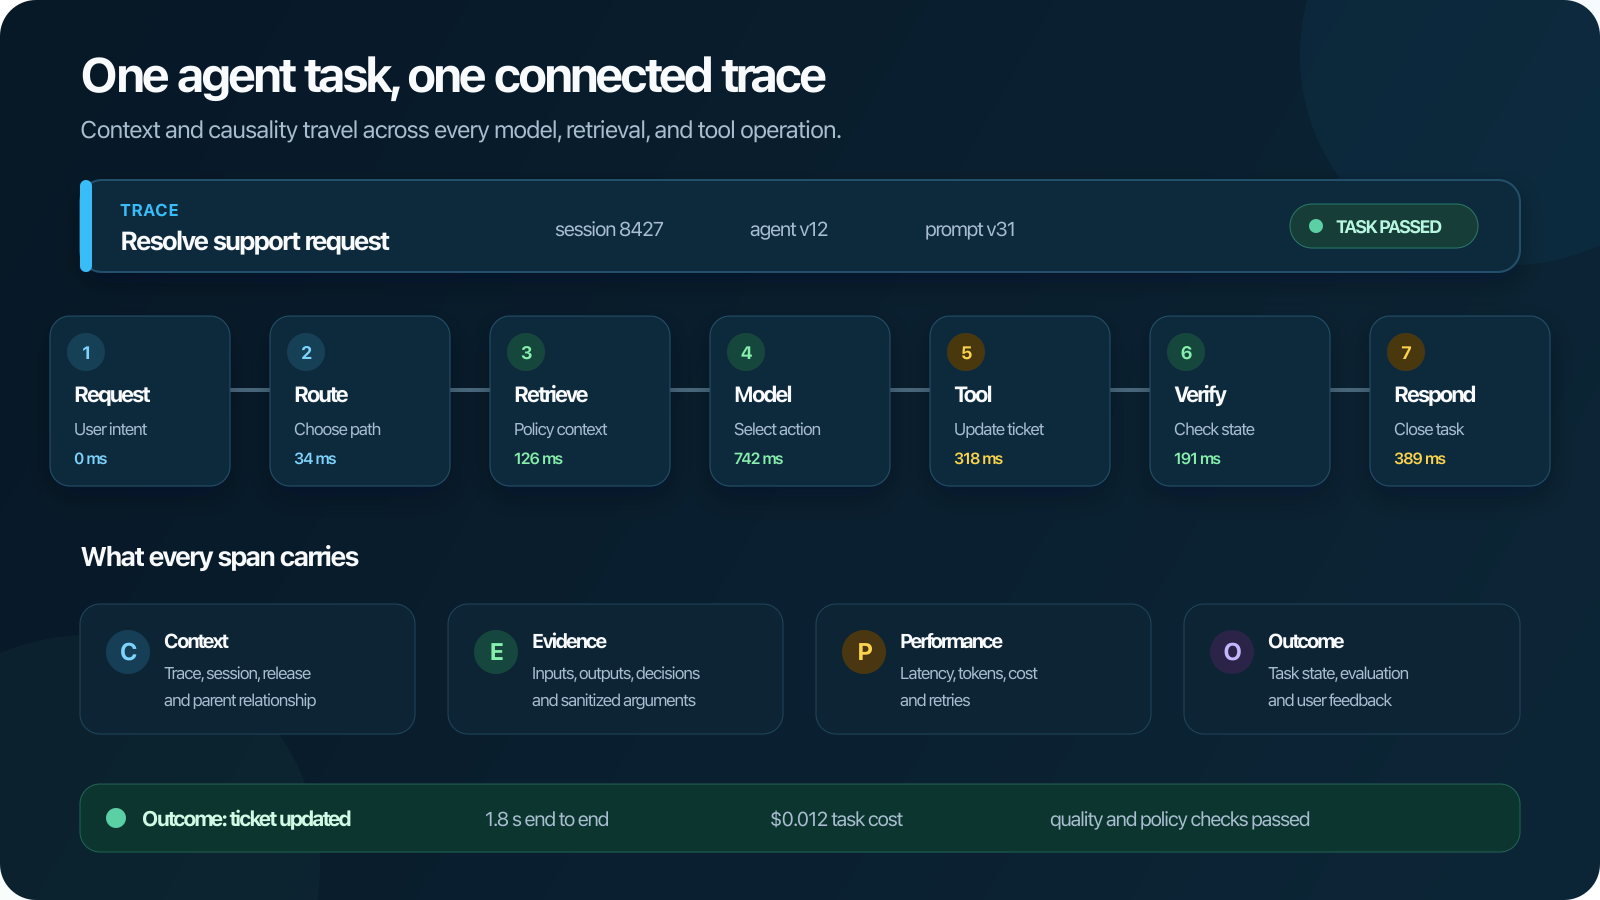
Trace ML requests and operations across APIs, queues, schedulers, storage, model services, and external tools without losing context or causality.
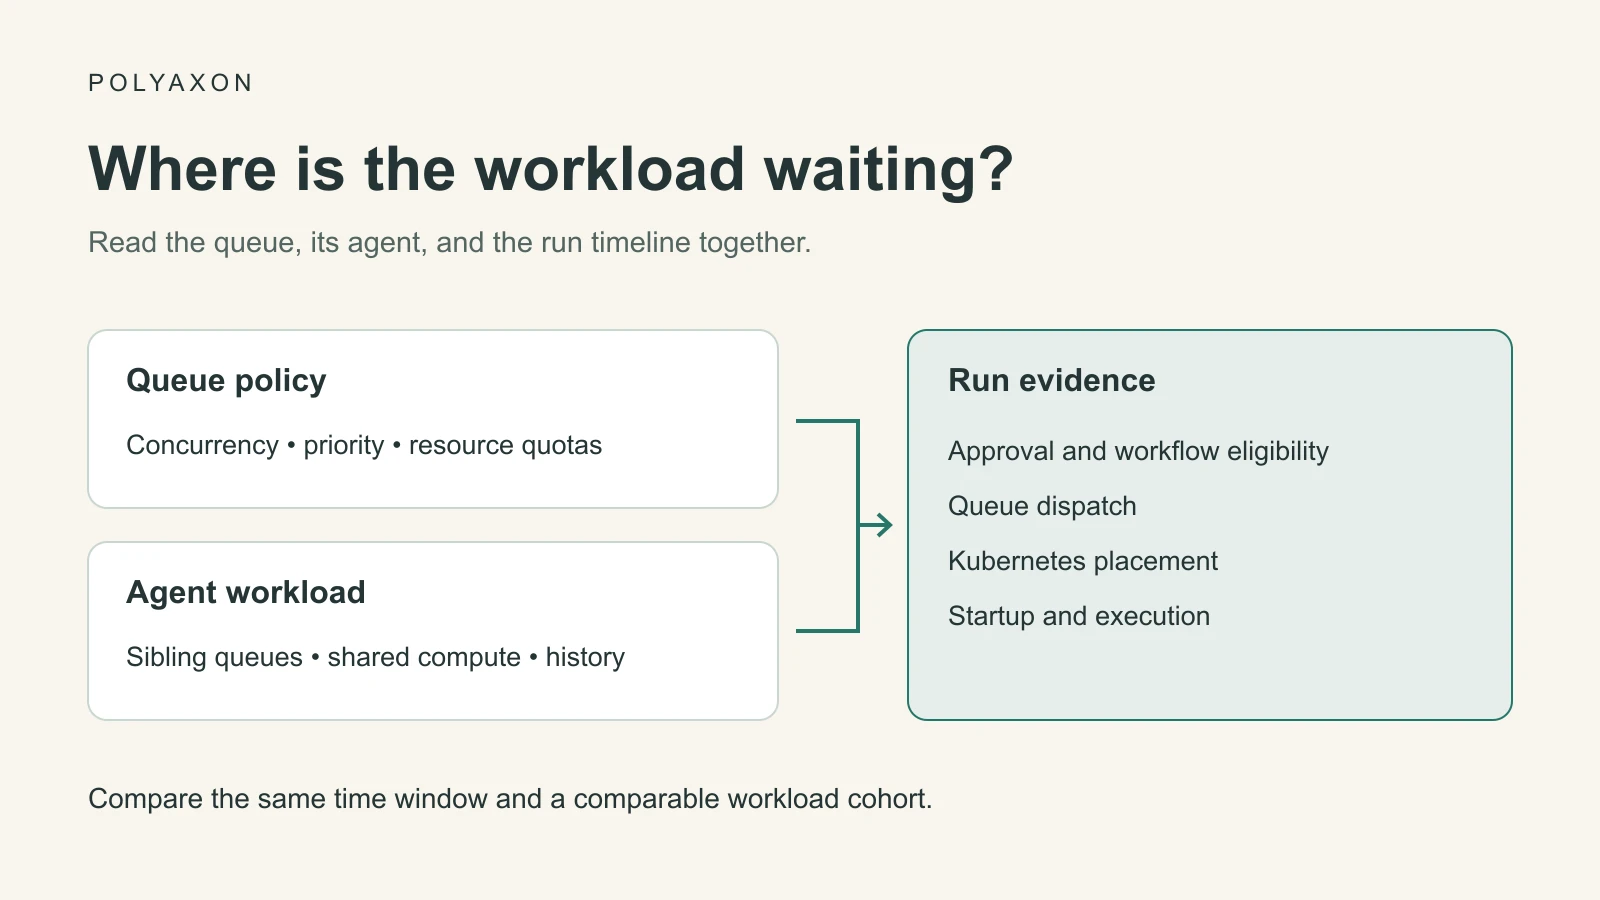
Use Polyaxon queue and agent statistics with run timelines to distinguish policy limits, workload changes, and Kubernetes placement problems before adding capacity.
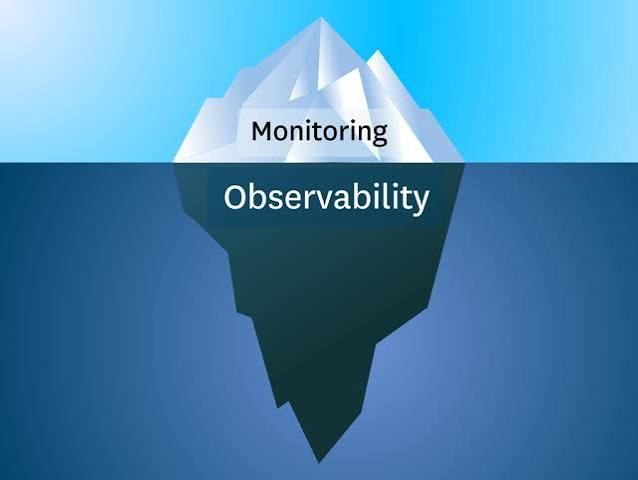
Instrument Java and Spring ML services with the OpenTelemetry agent, SDK, OTLP, domain spans, stable resource identity, and safe rollout controls.
Understand OpenTelemetry signals, APIs, SDKs, semantic conventions, OTLP, the Collector, and how they fit into an ML observability architecture.
Diagnose Kubernetes NotReady nodes through conditions, heartbeats, kubelet, runtime, networking, pressure, cloud health, and workload impact.
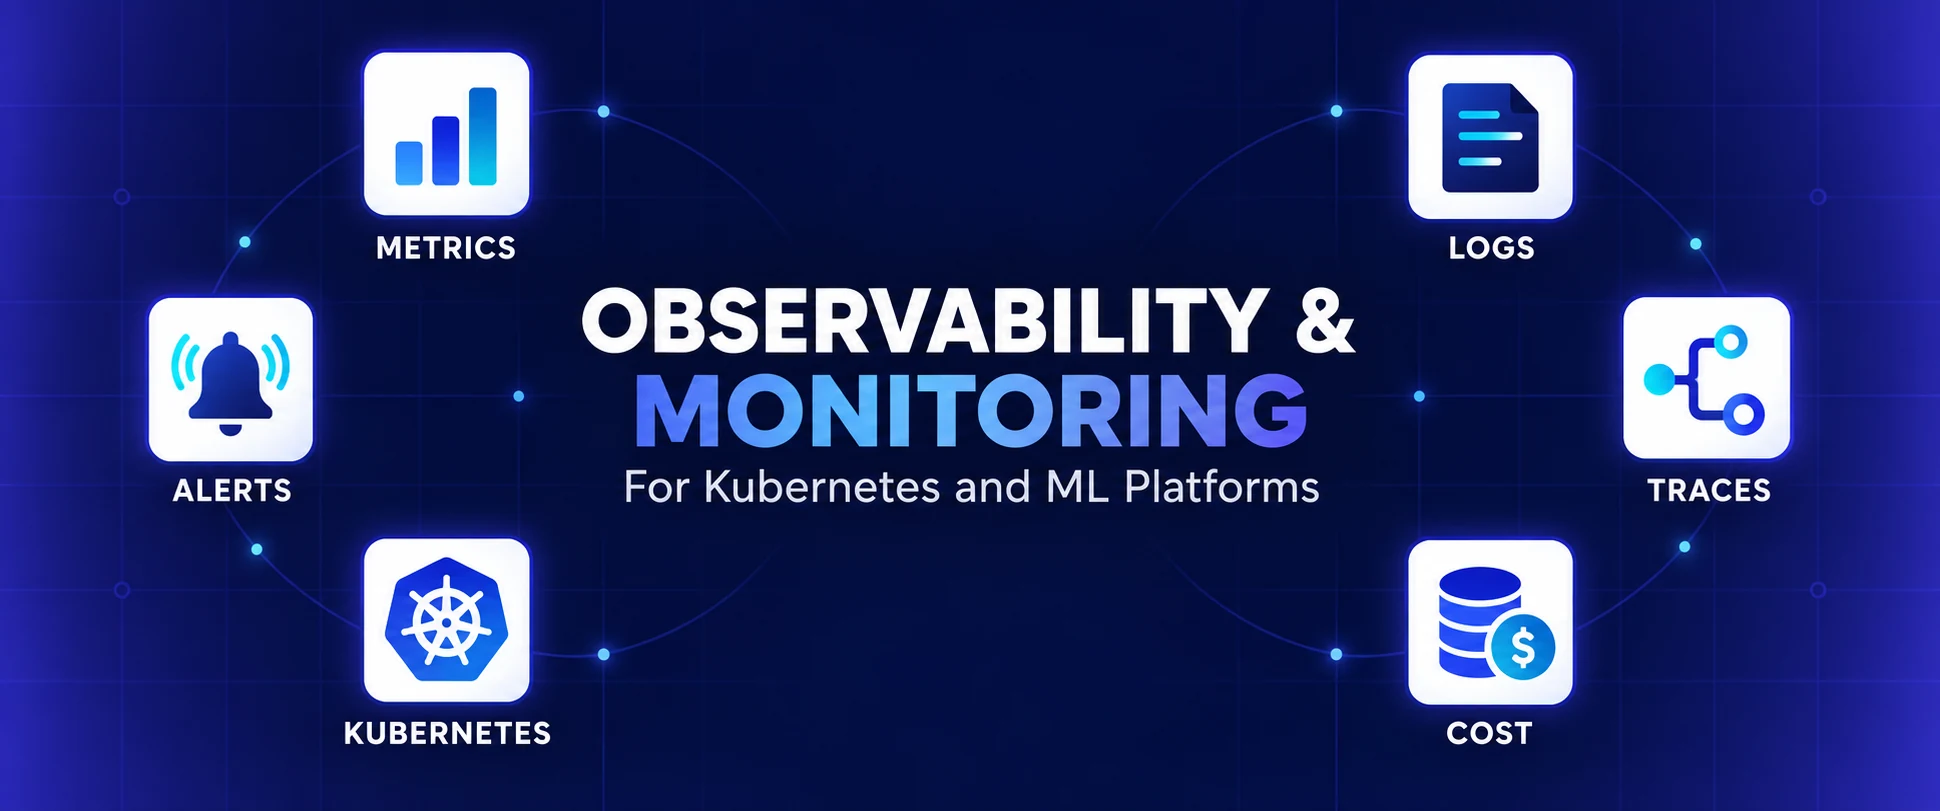
Evaluate observability tools by signals, Kubernetes context, ML workload coverage, operating model, cost, security, and incident workflow.

Turn short-lived Kubernetes events into durable incident evidence and low-noise alerts without treating them as a complete observability system.
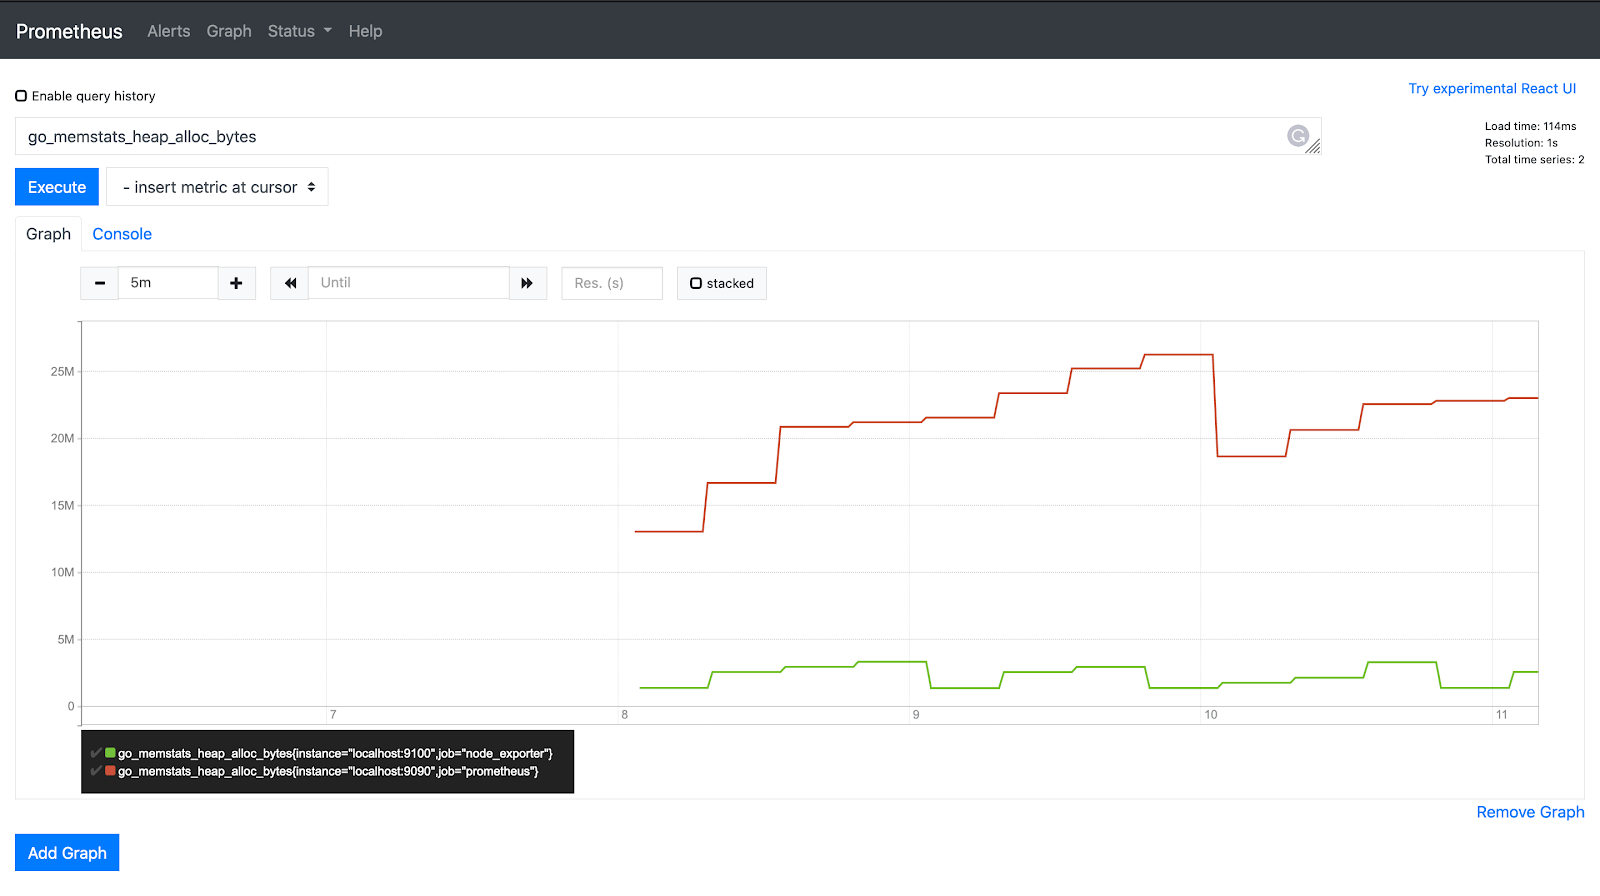
Use practical PromQL patterns for Kubernetes capacity, workload reliability, latency, and ML operations while controlling cardinality.
Design actionable Kubernetes alerts for ML services, batch operations, shared capacity, and the monitoring pipeline itself.
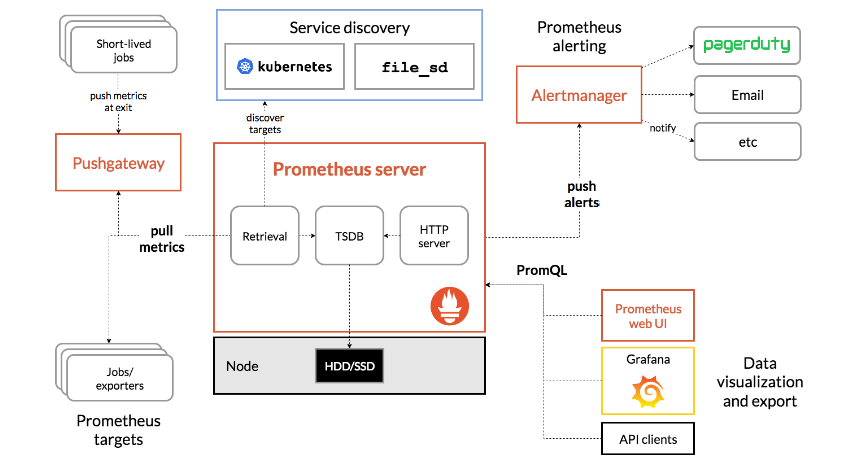
Build a useful Prometheus monitoring model across Kubernetes objects, nodes, containers, applications, and ML operations without uncontrolled cardinality.
Understand where eBPF adds kernel-level visibility in Kubernetes, which questions it can answer, and how to operate it safely for ML workloads.
Connect NGINX metrics to Prometheus with the NGINX Prometheus exporter and configure scraping for basic service monitoring.
Learn how Prometheus exporters expose third-party metrics, how to build a simple exporter, and what practices keep metrics useful.
Understand Prometheus metric types, collection architecture, storage behavior, custom metrics, and Kubernetes monitoring use cases.
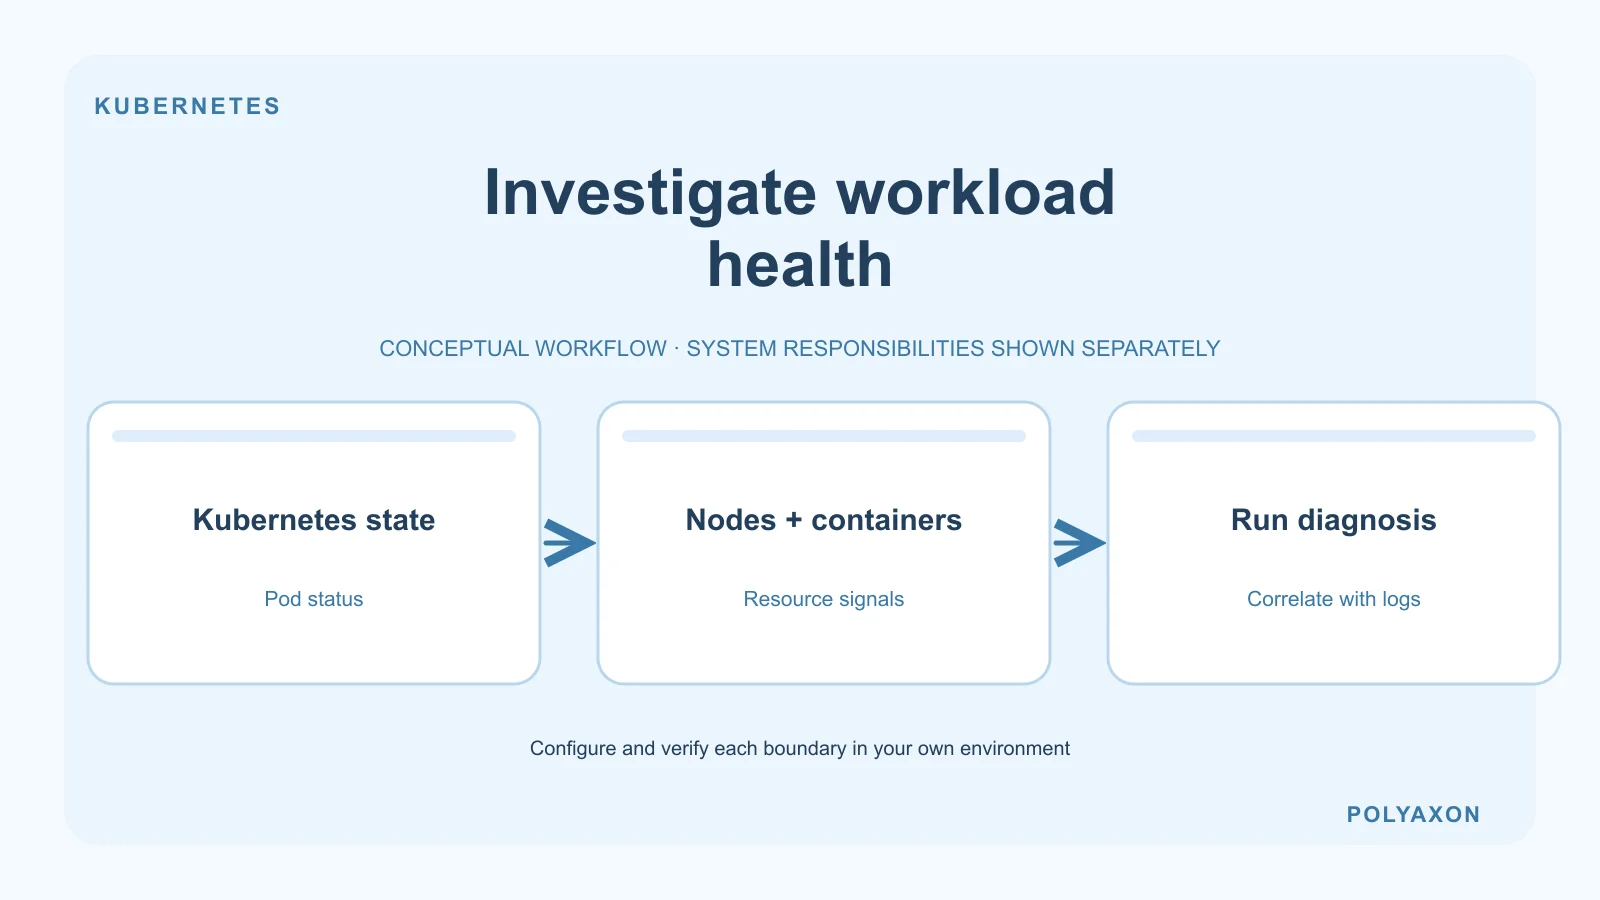
Correlate Kubernetes object state, container usage, and node health when investigating a Polyaxon workload.
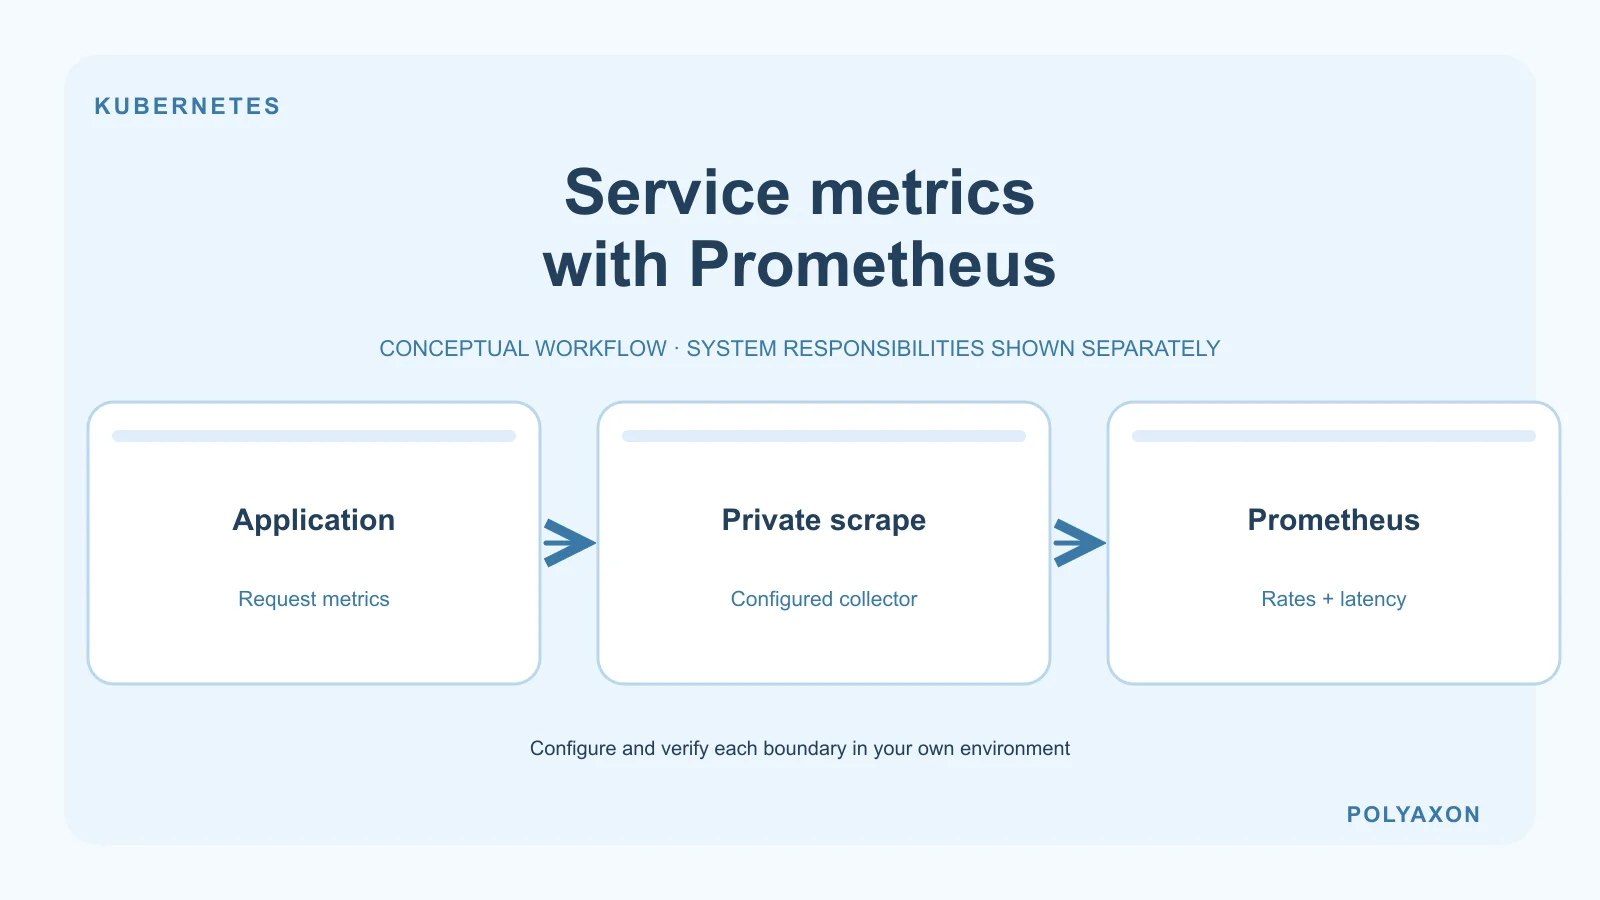
Instrument application request metrics in a Polyaxon service and configure a separate Prometheus collector to scrape them.
Monitor Kubernetes control planes, nodes, containers, schedulers, applications, and ML outcomes with useful correlations and controlled cardinality.
Choose between Datadog, Amazon CloudWatch, or a combined approach for EKS and ML workloads by testing coverage, ownership, portability, and cost.
Evaluate Datadog and AppDynamics against application transactions, Kubernetes infrastructure, ML workflows, telemetry governance, and operating cost.
Compare Datadog and New Relic for Kubernetes-based ML workloads using telemetry coverage, workflow context, investigation speed, governance, and cost.