Distributed tracing for ML platforms
Trace ML requests and operations across APIs, queues, schedulers, storage, model services, and external tools without losing context or causality.
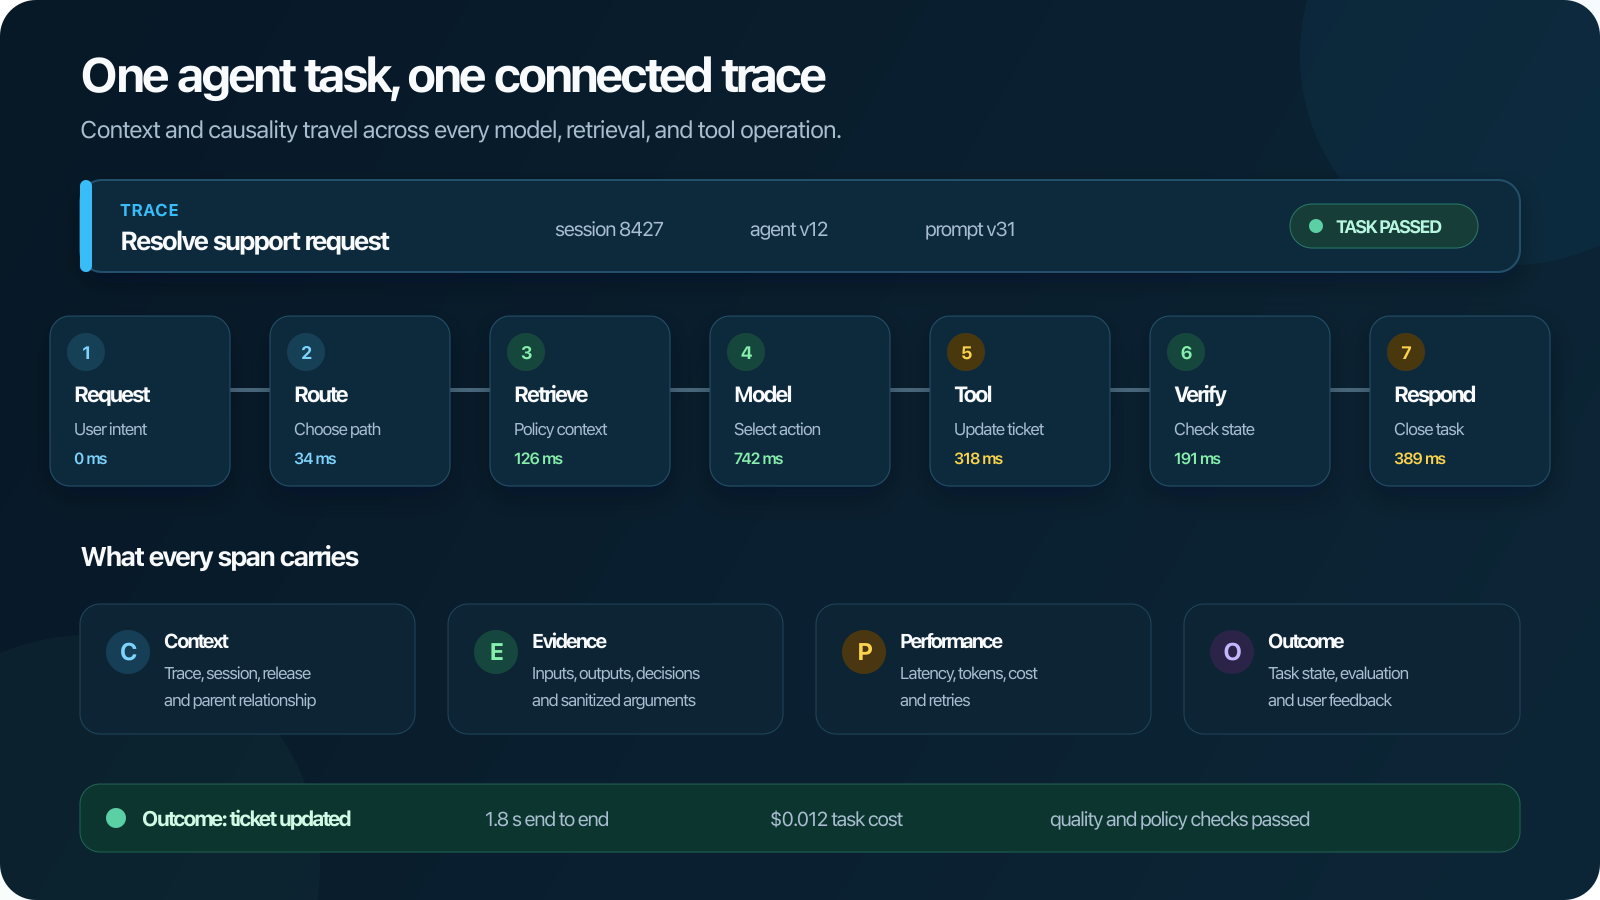
Distributed tracing follows one unit of work across process, service, queue, and network boundaries. It reconstructs causality that ordinary service metrics cannot show: which request triggered which downstream call, where time was spent, and which dependency returned an error.
For ML platforms, the unit of work may be a user request, pipeline step, training submission, inference call, retrieval operation, or agent action. The trace should explain the execution path without pretending that infrastructure latency alone explains model quality.
Build the trace from spans
OpenTelemetry's trace documentation defines a trace as a tree of spans. Each span represents one operation and normally includes:
- trace and span identifiers;
- parent relationship;
- operation name and service identity;
- start time and duration;
- status, events, and selected attributes;
- links to related work that is not a direct parent-child call.
The trace ID ties a trace together. A span ID identifies one operation within it. Parent-child relationships can describe synchronous or asynchronous work; they are not limited to calls that block their caller. Links connect additional causal relationships, including work from another trace or messages processed together when a span can have only one parent.
For messaging, follow the instrumentation's OpenTelemetry conventions. Consumer spans link to message creation contexts; a single-message consumer can optionally use that context as its parent. A batch consumer cannot make several producers its parents, so links preserve those relationships.
Use stable span names such as POST /runs, queue.publish, or model.generate. Put high-cardinality values such as request IDs into attributes, not span names, so the backend can group operations consistently.
Propagate context across every boundary
A trace breaks when context is not carried to the next service. Standard propagation headers work for HTTP and RPC, but asynchronous systems need explicit context in message metadata or task envelopes.
Map the boundaries in an ML workflow:
- browser or SDK to platform API;
- API to queue or workflow engine;
- controller to Kubernetes workload;
- workload to storage, registry, feature, or data service;
- model gateway to provider or model server;
- agent to retrieval, tool, and handoff operations.
Do not place credentials, prompts, datasets, or unrestricted user content into propagation fields. Propagation is for correlation context, not payload transport.
Retries need a deliberate model. Keep attempts distinguishable, record the retry reason, and preserve the relationship to the original operation. Otherwise, a successful final attempt can hide the time and cost of earlier failures.
For example, a submission API may enqueue a training request and return before a worker starts. Retain the message's creation context in its metadata. When the worker consumes it, create the processing span using the queue instrumentation's parent/link policy and attach the logical run identifier as a controlled attribute. A retry becomes a distinguishable attempt linked to the same logical work; it should not overwrite the earlier failure.
Instrument the boundaries that explain latency
Start with ingress, egress, database, message, and storage calls. Then add domain spans where generic library instrumentation cannot explain the work:
- waiting for workload admission;
- resolving execution policy;
- loading a dataset or model artifact;
- checkpointing;
- tokenization, retrieval, reranking, or generation;
- tool selection and execution;
- evaluation and output validation.
Avoid a span for every tiny function. Useful spans represent remotely meaningful work, expensive local work, or a decision an operator may need to investigate.
Automatic instrumentation provides broad coverage, but manual domain instrumentation gives the trace meaning. Use both rather than treating them as alternatives.
Distinguish request traces from run lineage
A distributed trace is optimized for an execution path over a relatively short period. ML lineage describes durable relationships among code, data, configuration, artifacts, models, evaluations, and deployments.
One training run may generate many traces. One online inference trace may reference a model produced weeks earlier. Store the durable run or model identifier as a controlled attribute or link, then use Polyaxon metadata to navigate the longer lifecycle.
| Identifier | Answers | Retention concern |
|---|---|---|
| Trace/span IDs | Which calls or steps contributed to this execution? | Sampling and trace retention can remove detailed telemetry |
| Logical run ID | Which configuration, attempts, and outputs belong to this operation? | Keep the run and its artifact records accessible |
| Model/dataset version | Which retained package or input snapshot was used? | Preserve the underlying bytes and access policy, not only a label |
Use an attribute for an ordinary run UUID. An OpenTelemetry span link expects a valid span context; a model version string is not a substitute for one.
Do not force full datasets, parameter maps, or model outputs into the tracing backend. Keep the trace focused on causality and connect it to the system designed to retain ML context.
Control sampling and sensitive data
Keeping every span can become expensive, especially for high-volume inference. Head sampling makes an early decision and is operationally simple. Tail sampling evaluates a completed or partial trace and can retain errors, slow requests, rare routes, or selected workload classes.
Sampling changes what questions the data can answer. Record the policy, test it during incidents, and preserve unbiased data where rate calculations depend on representative sampling.
Apply allowlists and redaction before export. Span attributes can contain URLs, SQL, file paths, prompts, tool arguments, user identifiers, or authentication material. Baggage deserves extra caution because it propagates across services.
Correlate traces with metrics and logs
Metrics efficiently show that error rate or latency changed. Traces identify representative execution paths. Logs supply detailed events that do not fit span attributes.
Add trace and span IDs to structured logs. Use exemplars or backend links to move from an aggregate metric to a relevant trace. Keep service, environment, cluster, and version naming consistent across all three signals.
A trace should not replace an alert. It supplies the evidence needed after monitoring identifies a meaningful condition.
Connect tracing to Polyaxon
Polyaxon platform observability covers the services that submit, schedule, and track ML workloads. Run logging preserves operation output, while run metadata connects execution to inputs, parameters, metrics, and artifacts.
For generative AI and agents, AI agent tracing extends the path through retrieval, model calls, tools, state, and handoffs. The same trace must also connect to evaluations and outcomes; a technically fast request can still be incorrect or unsafe.
Distributed tracing is useful when it preserves causality across boundaries and links back to the logical ML operation. Instrument the path users care about, control what enters telemetry, and make every retained span help answer an operational question.