AI agent tracing: How to debug tools, loops, and handoffs
AI agent tracing connects model calls, retrieval, tools, state, and handoffs so teams can explain failures, latency, cost, and outcomes.
When an AI agent fails, the final response rarely tells the complete story. The agent may have retrieved the wrong document, selected an inappropriate tool, constructed invalid arguments, retried a step, lost state during a handoff, or spent most of its time waiting on an external service.
AI agent tracing records that execution as a connected sequence of steps. It gives teams the evidence needed to reconstruct what happened, locate the source of a failure, and compare behavior across agent versions.
What is AI agent tracing?
AI agent tracing is the practice of capturing the end-to-end path of an agent task, including model calls, retrieval operations, tool calls, state changes, routing decisions, handoffs, errors, evaluations, and the final outcome.
A trace represents one logical task or interaction. It contains spans, with each span representing a unit of work. Parent-child relationships preserve the structure of the execution, while timing data shows which steps ran sequentially, in parallel, or repeatedly.
For example, a support-agent trace might contain:
- Receive the user request.
- Classify the intent.
- Retrieve an account and relevant policy.
- Ask a model to choose an action.
- Call the ticketing or refund tool.
- Verify the updated state.
- Generate the final response.
If the agent retries the refund tool or hands the case to a specialist agent, those operations appear in the same connected execution.
This structure adapts distributed tracing to the semantics of generative AI systems. Traditional spans describe services, databases, and network calls. Agent spans add context about models, prompts, tokens, tools, retrieval, sessions, and outcomes.
Why application logs are not enough
Logs remain useful for recording discrete events, but a stream of messages does not automatically preserve causality. A team investigating a slow or incorrect task may need to manually correlate events across an API, model provider, retriever, tool service, and agent framework.
A trace supplies the shared context:
- One trace ID connects the complete task.
- Span IDs and parent relationships show which operation caused another.
- Start and end times reveal the critical path and parallel work.
- Attributes preserve model, prompt, tool, and application versions.
- Events record retries, exceptions, state transitions, and evaluator results.
- Links connect related work that does not fit a strict parent-child tree.
Metrics summarize behavior across many requests, while logs describe individual events. Traces explain the path of one request. A strong AI observability practice correlates all three with evaluations, feedback, and business outcomes.
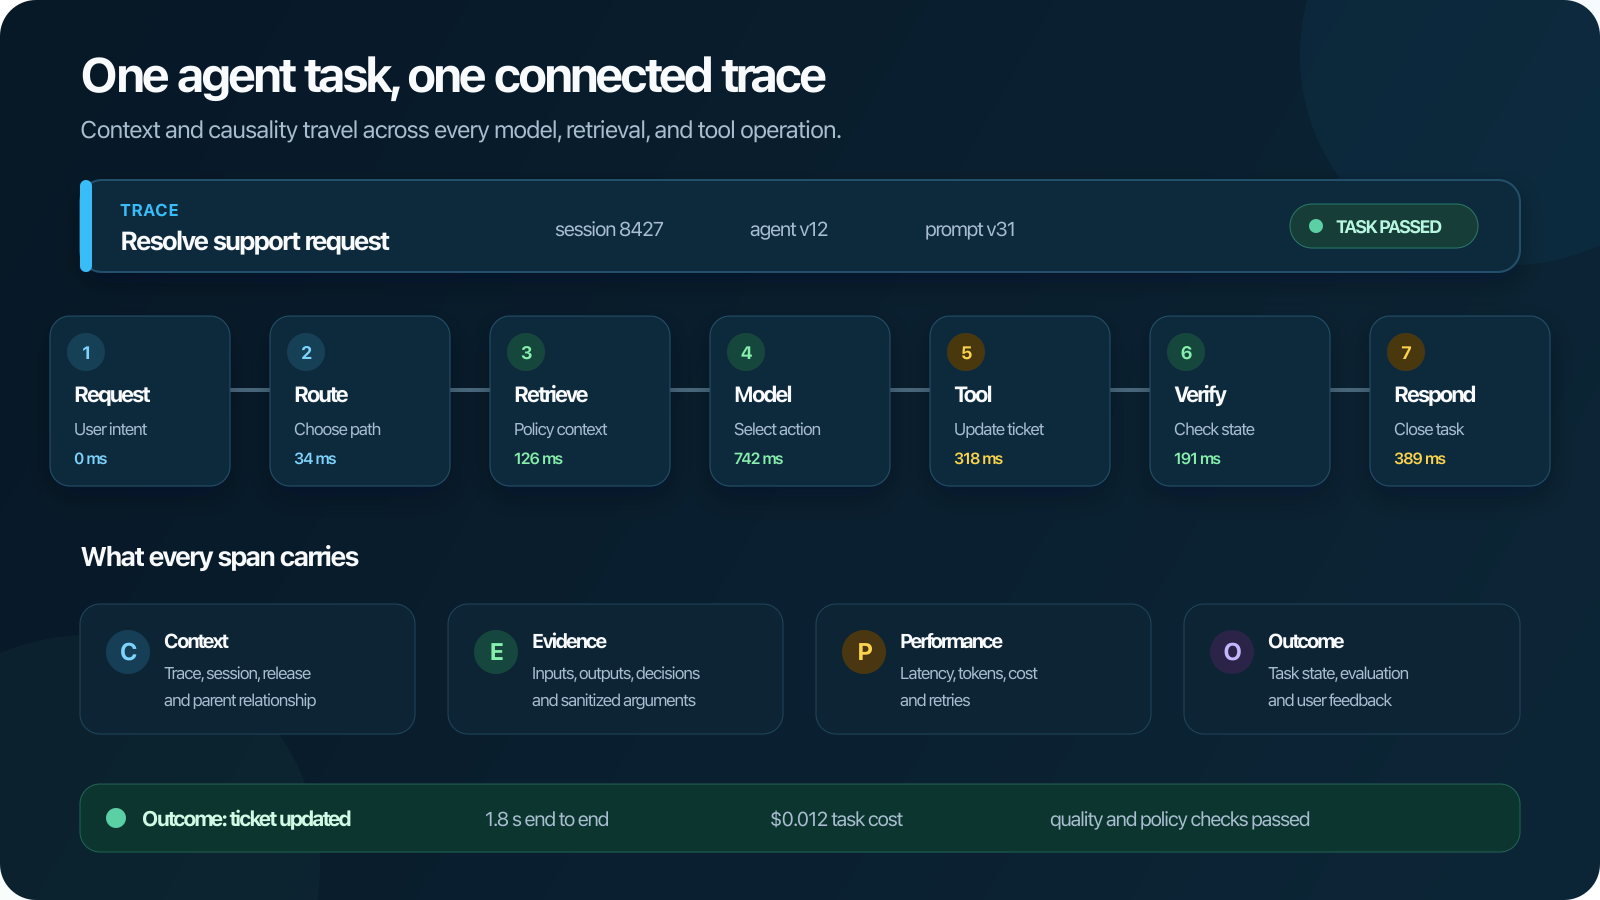
The anatomy of an agent trace
A useful trace should follow the task across the application boundary instead of stopping at the LLM API.
Session and task context
The trace needs stable identifiers for the user interaction, conversation or session, task, and application version. These fields make it possible to connect several turns while keeping each task independently inspectable.
Useful context includes the environment, tenant or account, release, feature flags, entry point, and user segment. Sensitive identifiers should be hashed, tokenized, or omitted according to the application's privacy requirements.
Model operations
For each model call, record the provider, model, operation, prompt or message version, inference parameters, input and output token counts, latency, finish reason, response status, and error details.
Full prompt and response content can be valuable for debugging, but it also creates privacy, security, retention, and volume concerns. Treat content capture as an explicit policy decision. Metadata and content should have separate controls.
Retrieval operations
Capture the query, data source or index version, filters, retrieved document identifiers, ranking or relevance scores, and the context passed to the model. This allows a team to distinguish retrieval failure from generation failure.
Avoid copying entire source documents into every trace by default. Stable document identifiers and controlled access to the underlying content may provide the necessary lineage with less duplication and exposure.
Tool calls
A tool span should identify the tool and version, sanitized arguments, result status, latency, retries, external request identifier, and any resulting state change. If the tool can perform a sensitive action, include the authorization decision and policy version.
The trace should distinguish several failure modes:
- The agent selected the wrong tool.
- The correct tool received invalid arguments.
- The tool rejected an unauthorized request.
- The external service timed out or returned an error.
- The tool succeeded, but the agent interpreted the result incorrectly.
Those failures may look similar in the final response but require different fixes.
State and memory
Record meaningful state transitions rather than taking an unrestricted snapshot after every token. Useful fields include the state schema version, the keys changed, memory reads and writes, context truncation, and the checkpoint associated with a step.
For long-running agents, state checkpoints support replay and recovery. They also help identify where context was lost or an earlier assumption continued to influence later actions.
Routing and handoffs
When a router selects a specialist agent or one agent delegates work, capture the source agent, destination agent, reason, payload schema, relevant context, and result. Trace or span links can represent asynchronous or cross-task relationships that are not naturally nested.
Handoff context is especially important in multi-agent systems. The receiving agent may execute correctly based on incomplete instructions, making the defect appear downstream from its actual origin.
Evaluations and outcomes
Attach evaluation results and feedback to the relevant trace or span. A tool-correctness evaluator belongs on the tool operation; a groundedness score may belong on the model response; task success belongs on the complete trace.
Also record the observable result: Was the ticket created? Did the account state change? Did the user accept the answer? A trace that ends at the final model response cannot show whether the task succeeded in the real system.
What to record for each agent step
The exact schema depends on the application, but this starting point keeps common investigations possible.
| Step | Record | Questions it can answer |
|---|---|---|
| Request | Session, task, user segment, application version, input metadata | Which users and releases are affected? |
| Routing or planning | Agent version, decision, available actions, selected action | Why did the agent choose this path? |
| Retrieval | Query, index version, filters, document IDs, scores | Did the agent receive relevant and current context? |
| Model | Provider, model, prompt version, parameters, tokens, latency, finish reason | Did a model or prompt change alter behavior, cost, or speed? |
| Tool | Tool version, arguments, status, result, retry, state change | Was the tool selection, invocation, and result correct? |
| Handoff | Source, destination, reason, payload, linked trace | Was necessary context transferred? |
| Evaluation | Evaluator and version, rubric, score, explanation | Which quality or safety requirement failed? |
| Outcome | Task state, user feedback, business result, total cost and latency | Did the complete task succeed at an acceptable operating cost? |
Version every component that can change behavior. A model name without the prompt version, tool schema, retrieval index, or application release leaves important gaps in the investigation.
Debugging common agent failures with traces
The agent called the wrong tool
Start with the routing or model span that produced the decision. Inspect the available tool definitions, instructions, relevant context, and selected tool. Compare the failure with successful traces for the same task type.
If the correct tool was unavailable or described ambiguously, fix the tool registry or schema. If the prompt ignored a clear distinction, update the instruction and add the trace to a tool-selection regression set.
The agent is stuck in a loop
Look for repeated span names, identical or near-identical arguments, unchanged state, and repeated model finish reasons. Measure loop length and cost at the trace level.
The root cause may be a tool that reports success without changing state, a missing stopping condition, an error hidden in an unstructured result, or a model that does not receive evidence of the previous attempt. A trace makes the repeated state visible instead of presenting only the eventual timeout.
A handoff loses important context
Compare the sender's state with the handoff payload and the receiver's initial context. Check whether identifiers, constraints, user intent, and prior tool results crossed the boundary. Verify schema versions on both sides.
If the receiver behaves consistently with the information it was given, the source of the failure is the handoff contract—not the receiving agent.
The task is slow
Use span timing to locate the critical path. A slow task may contain one slow model call, many individually fast calls, serialized work that could run in parallel, tool retries, or time spent waiting for user or external state.
Compare the trace with the total token count and output quality. A longer model response may contribute latency, but reducing it is useful only if task success remains acceptable.
Cost increased after a release
Group traces by application, model, prompt, tool, or retrieval version. Inspect calls per task, input and output tokens, retry rates, context size, loop length, and successful-task cost.
This can reveal whether the release selected a more expensive model, expanded the prompt, retrieved more documents, or caused additional steps. Aggregate spend alone cannot make that distinction.
The final answer is wrong
Trace backward from the output. Was the answer unsupported by the supplied context? Did retrieval miss the correct source? Did a tool return stale data? Did the agent discard a successful result during a later step?
This attribution is one of tracing's most important benefits. It allows the team to fix the component that introduced the error instead of rewriting the final prompt for every failure.
Traces, logs, metrics, and evaluations
These signals answer different questions and work best together.
| Signal | Best question |
|---|---|
| Trace | What path did this task take, and where did it fail or slow down? |
| Log | What event or detail did a component record? |
| Metric | How often is a behavior happening, and how is it changing over time? |
| Evaluation | Did this output, action, or task meet a quality, safety, or policy criterion? |
| Feedback | How did a user or reviewer experience the result? |
An evaluation alert can identify a decline in groundedness. Metrics can show when it began and which segment is affected. Traces can expose the retrieval and model steps behind individual failures. Logs can provide a detailed tool or service error. Together, the signals support a defensible root-cause analysis.
Design an agent-tracing model that lasts
Use stable trace boundaries
Define what one trace represents: an HTTP request, a conversation turn, a task, or a long-running workflow. For agents, a logical task is often more useful than a transport-level request because work can continue asynchronously or cross several services.
Connect related tasks with session identifiers and span links rather than forcing an entire conversation into one extremely long trace.
Standardize names and attributes
Consistent span names and attribute keys make comparisons possible across frameworks and services. OpenTelemetry provides a useful portability layer, and its generative AI semantic conventions standardize common model, agent, and tool concepts. The conventions continue to evolve, so record the schema or instrumentation version and expect migration.
Keep application-specific attributes for business context, but do not create a new naming scheme for every agent.
Control content separately from metadata
Prompt, output, retrieval, and tool content can be large and sensitive. Define collection, redaction, sampling, encryption, retention, and access policies before production rollout. Allow metadata-only tracing where full content is unnecessary or prohibited.
Never depend on an observability backend as the only protection for secrets. Redact or exclude sensitive values before export where possible.
Preserve versions and lineage
Record the application release, agent, prompt, model, retrieval index, tool schema, evaluator, and policy versions. This allows teams to reproduce behavior and compare a candidate fix with the exact failing configuration.
Combine head and tail sampling
High-volume systems may not retain every complete trace. Head sampling decides early; tail sampling can retain a trace after observing an error, high latency, high cost, failed evaluation, or unusual path.
Always retain events required for audit or incident response according to policy. Sample successful, ordinary traffic at a rate that still supports representative analysis.
Derive metrics from trace structure
Trace data can produce operational metrics such as:
- Task completion and abandonment rate.
- Model and tool latency by version.
- Calls, tokens, and cost per successful task.
- Retry and loop rate.
- Tool-selection and tool-execution failure rate.
- Handoff frequency and failure rate.
- Retrieval depth and context size.
- Evaluation pass rate by task and release.
Keep the trace available for examples behind the aggregate. A dashboard shows the pattern; the trace explains it.
Turn traces into an improvement loop
Tracing becomes valuable when it changes how the team works.
- Detect a quality, safety, reliability, latency, or cost issue.
- Select representative traces from the affected segment.
- Identify the step and version associated with the failure.
- Remove or protect sensitive data and convert the case into a reproducible test.
- Evaluate candidate changes against the regression set and broader benchmark.
- Release the fix with appropriate controls.
- Compare production traces and outcomes with the earlier version.
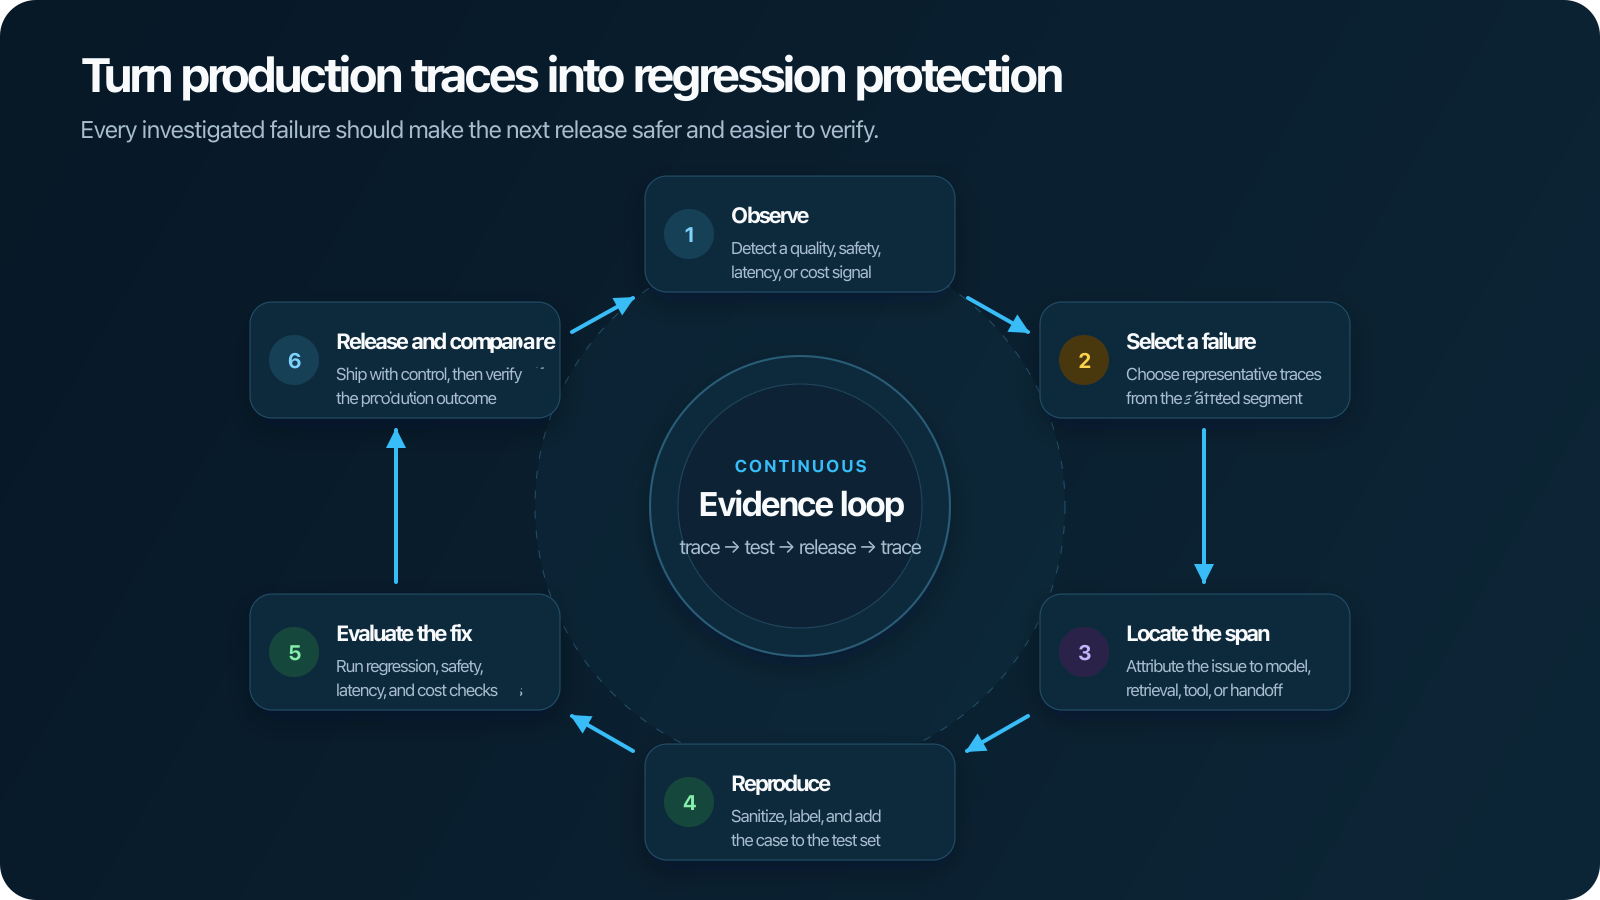
This workflow connects tracing with AI agent evaluation and the broader LLMOps lifecycle. Production is not the end of the lifecycle; it supplies the evidence for the next experiment.
Common agent-tracing mistakes
Tracing only model calls
Model spans cannot explain missing retrieval context, invalid tool arguments, state corruption, or handoff failures. Trace the complete task path.
Capturing content without a privacy model
Prompts and tool results can contain credentials, personal data, source code, or customer records. Apply least-privilege access, redaction, retention, and sampling deliberately.
Omitting version context
A trace without prompt, tool, agent, retrieval, and application versions may be impossible to reproduce. Treat version fields as part of the trace schema.
Collecting spans without outcomes
A perfectly rendered trace does not indicate whether the task succeeded. Attach task state, evaluation results, user feedback, or a business outcome.
Using high-cardinality values as metric labels
Trace IDs, user IDs, full prompts, and document content do not belong in metric dimensions. Keep detailed values on traces and use bounded categories for aggregation.
Treating tracing as surveillance
Collect telemetry for defined reliability, quality, safety, and governance purposes. Document the policy, minimize content, and restrict access. More captured data is not automatically more useful observability.
Polyaxon and the agent-observability roadmap
Polyaxon's current experiment tracking, orchestration, and platform observability provide a foundation for versioned workflows, operational metadata, and infrastructure context.
Full OpenTelemetry-compatible LLM and agent observability is an active area on the Polyaxon roadmap. The roadmap also includes evaluations, an AI gateway, prompt management and optimization, and an agent sandbox for inspecting execution, state, and performance step by step.
The intended experience connects an agent trace with the application version, evaluation evidence, infrastructure behavior, and the workflow used to test a fix. That connection is what turns telemetry into an operational feedback loop.
Trace the task, not only the model
Agents are distributed, stateful applications whose behavior emerges across models, retrieval, tools, memory, and handoffs. Debugging them from a final response or a collection of unrelated logs leaves too much of the execution hidden.
Trace the complete task, preserve causality and version context, attach evaluations and outcomes, and control sensitive content deliberately. With that evidence, a team can move from “the agent behaved strangely” to a specific failure, a reproducible case, and a measurable fix.