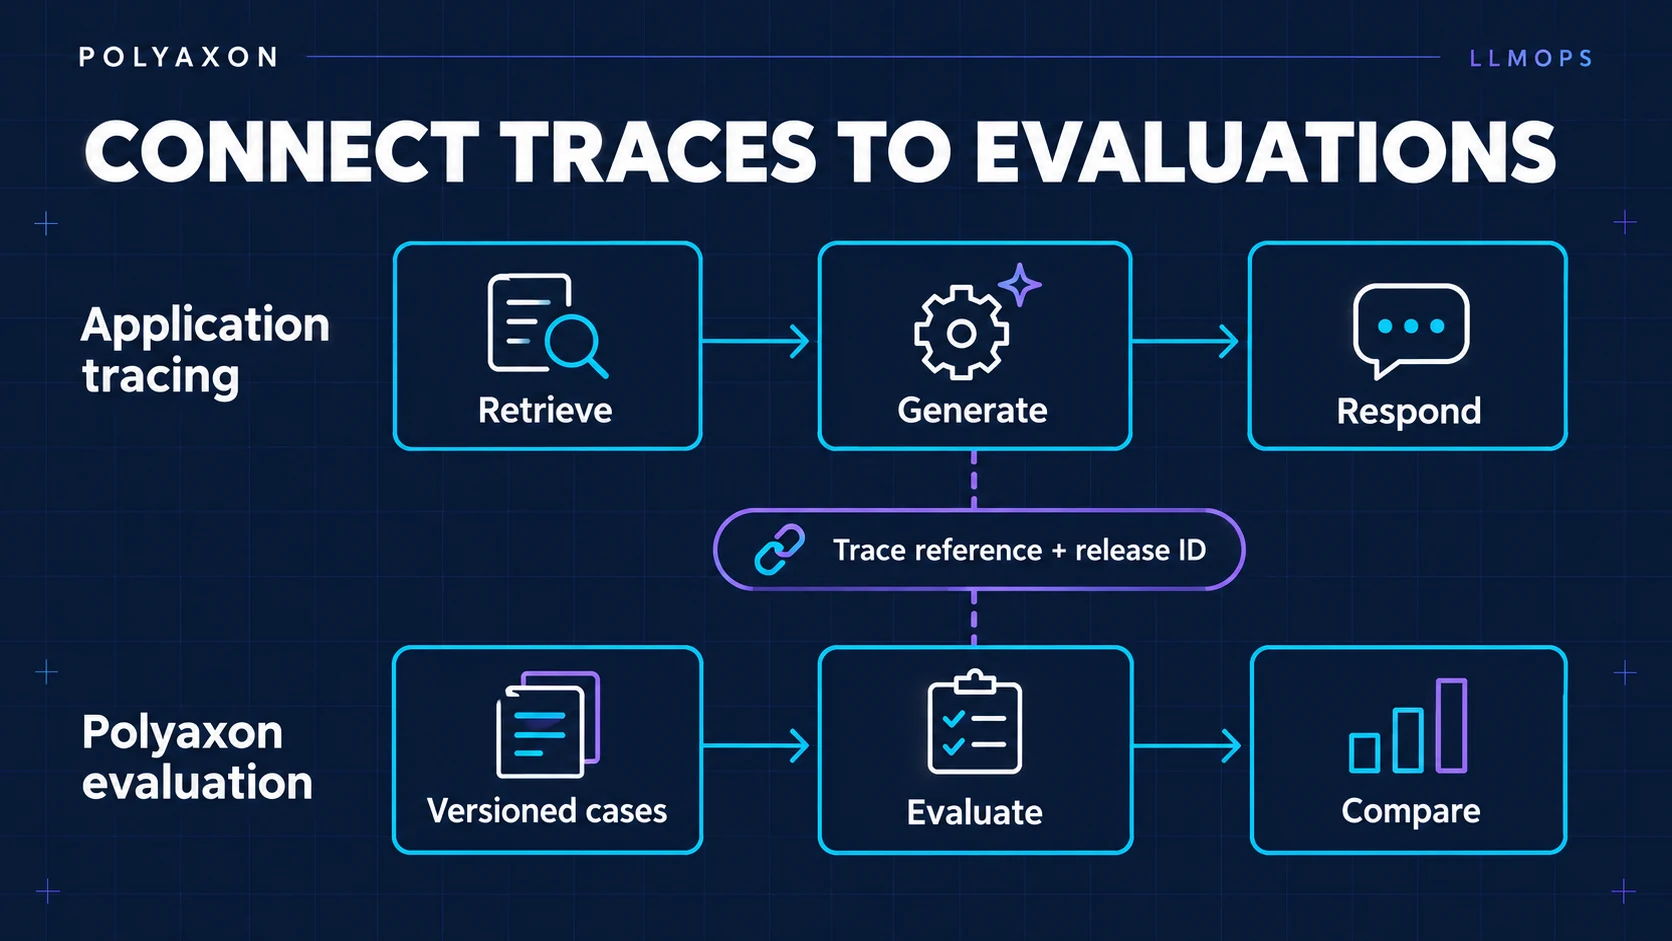
Connect LLM production traces to evaluation runs
Keep release, dataset, evaluator, and sampling context connected as you investigate LLM failures and compare fixes with Polyaxon.
LLMOpsObservabilityEvaluation
The latest guides, tutorials, and product updates.
Keep release, dataset, evaluator, and sampling context connected as you investigate LLM failures and compare fixes with Polyaxon.
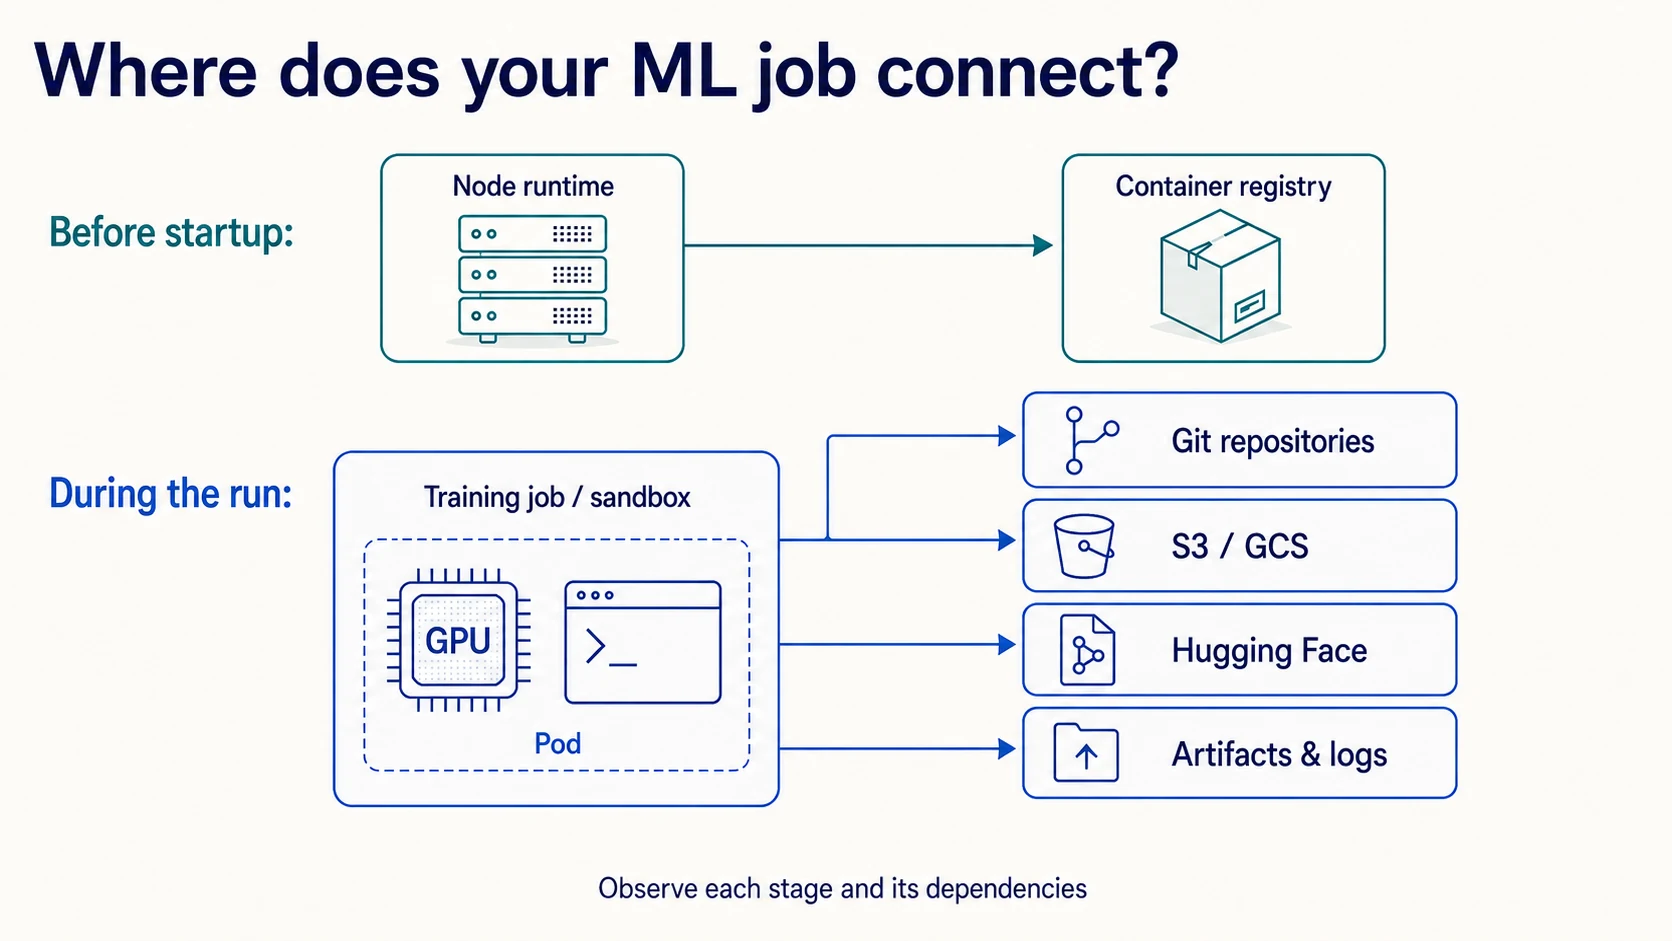
Trace image pulls, Git clones, S3 and GCS access, Hugging Face downloads, and artifact uploads across the lifecycle of Kubernetes jobs and sandboxes.
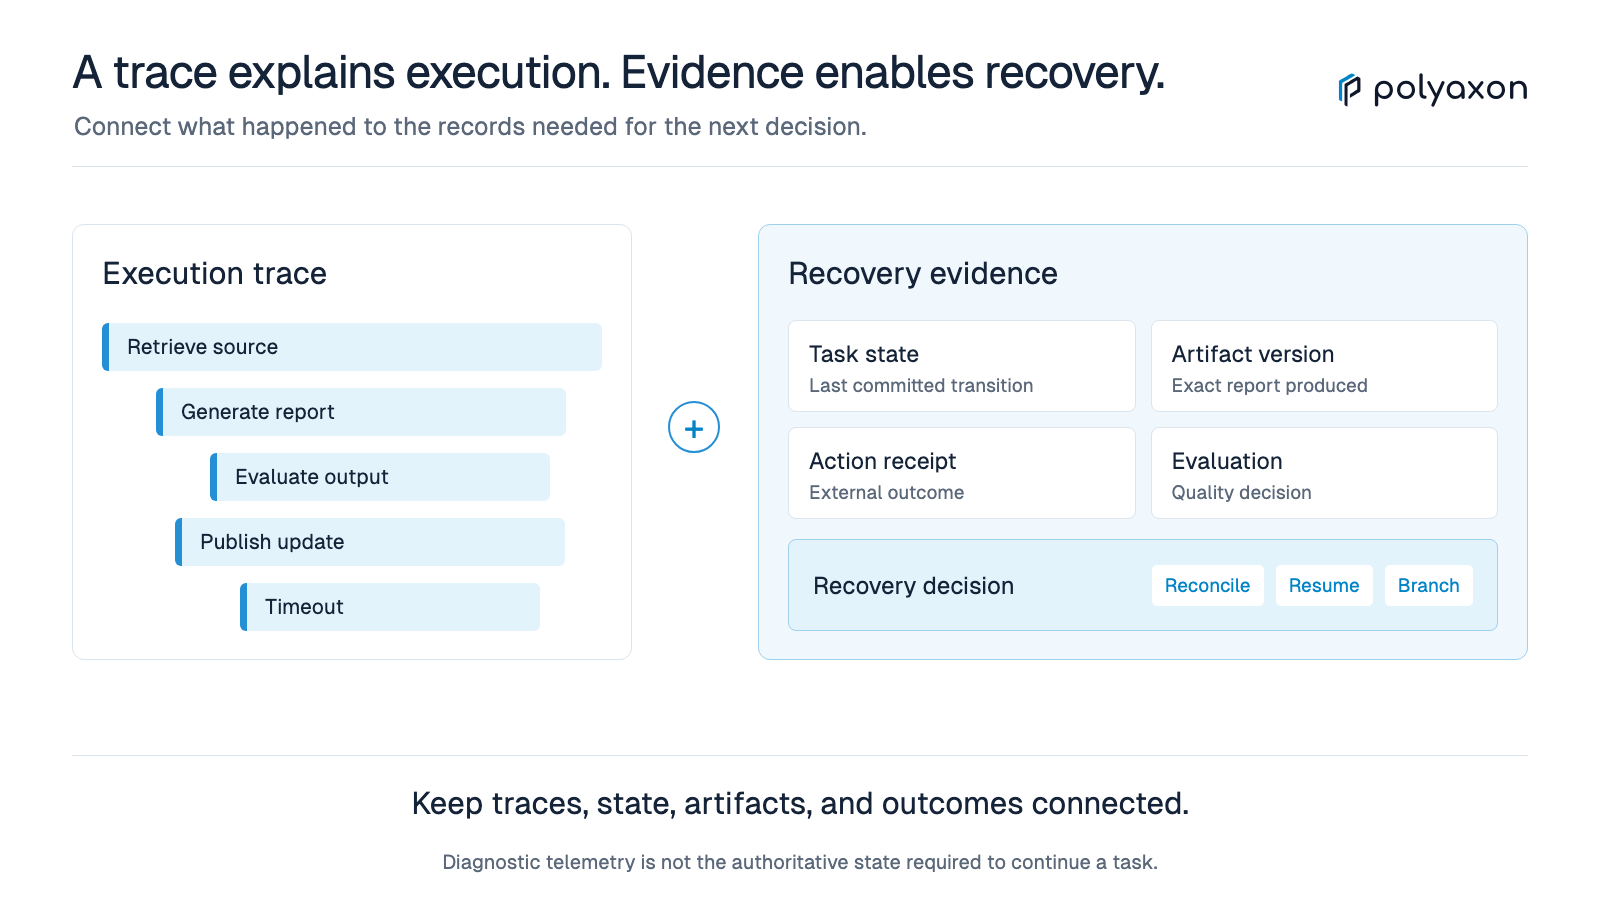
Connect agent traces to checkpoint state, versioned artifacts, action receipts, and evaluations so failures lead to controlled recovery and reproducible improvements.
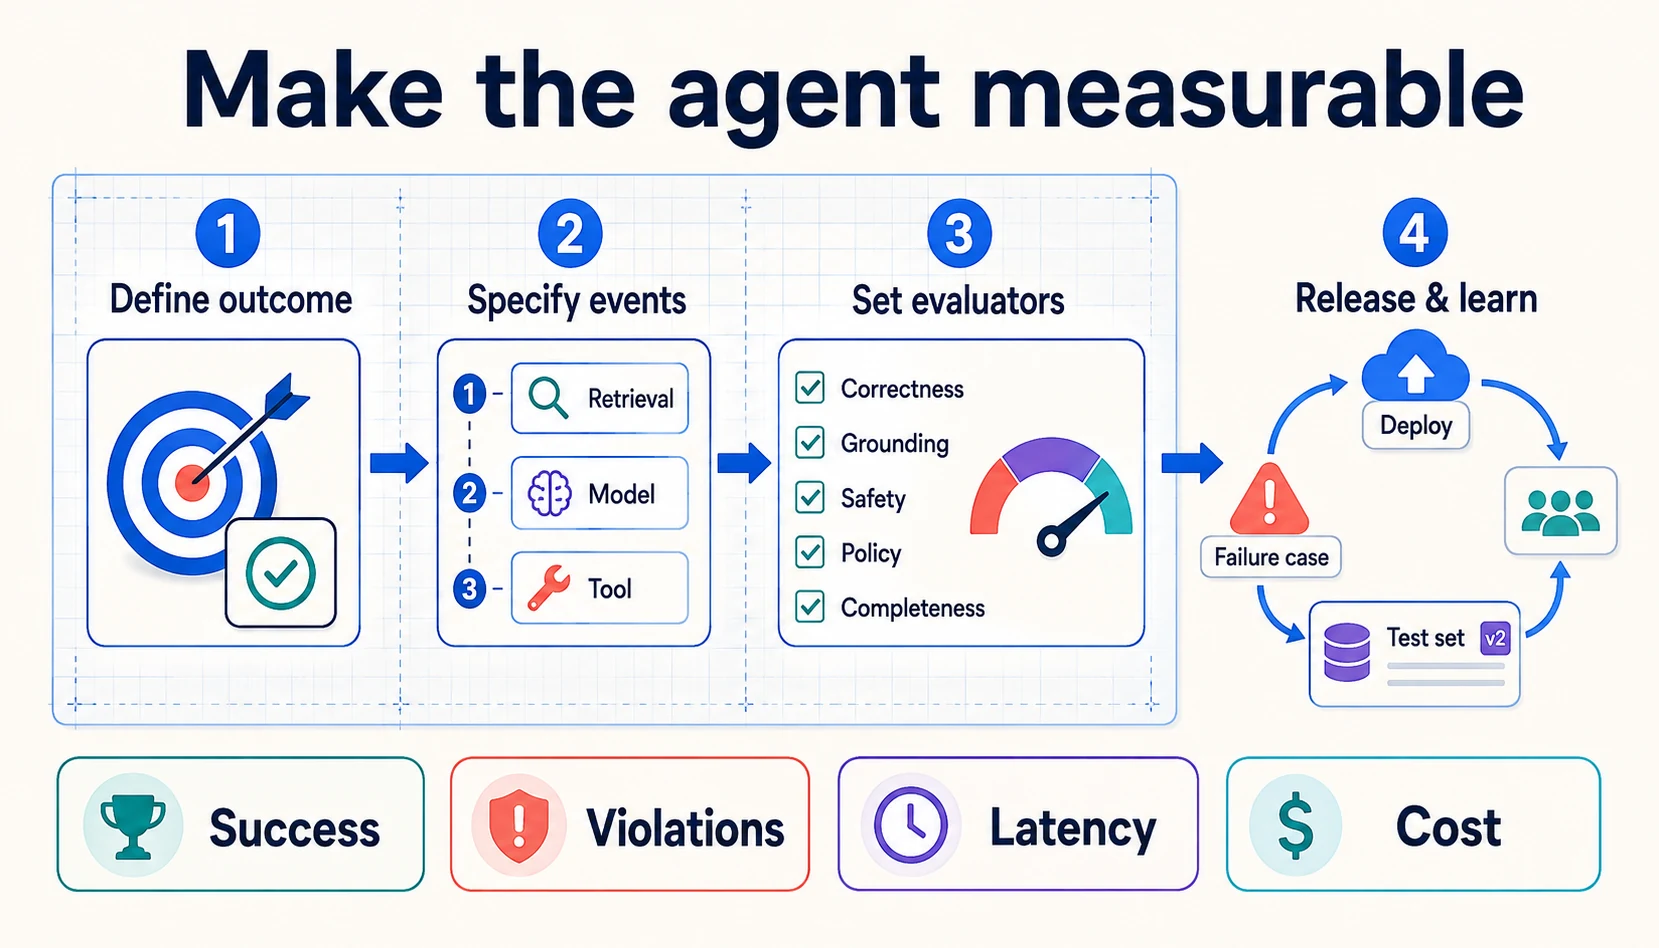
Define agent outcomes, prohibited actions, events, evaluators, budgets, segments, and feedback loops before implementation begins.
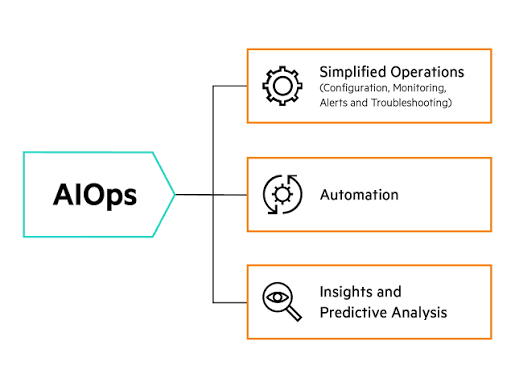
Use AIOps to investigate ML incidents and automate low-risk remediation without giving an AI system unrestricted production access.
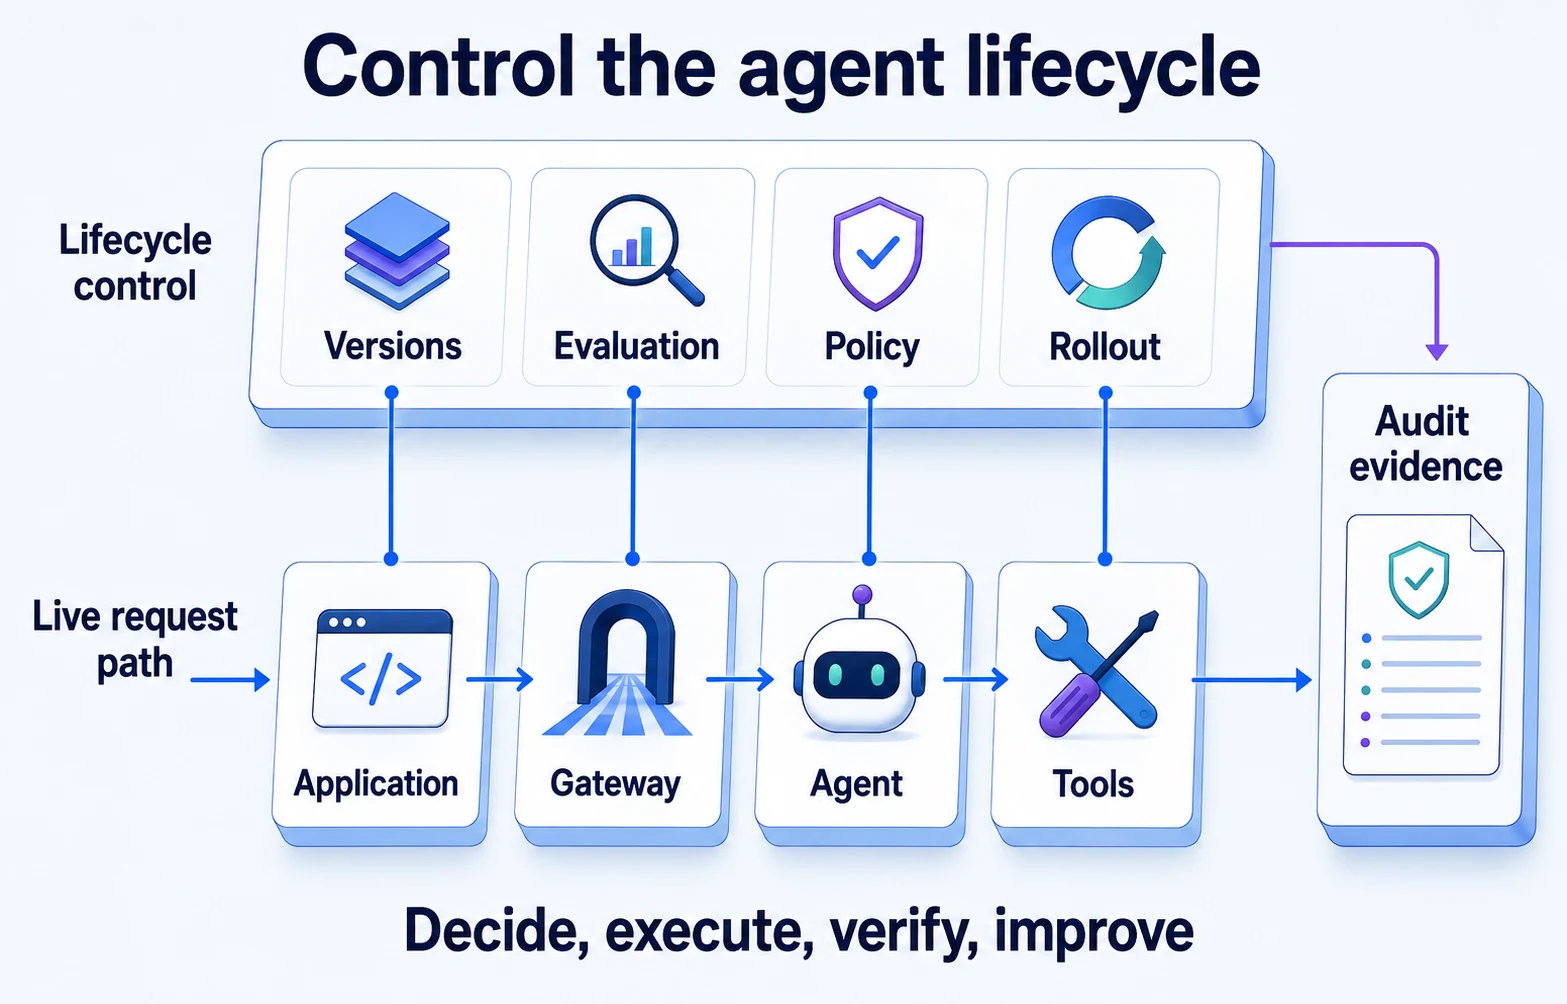
Separate live agent requests from versioning, evaluation, policy, rollout, identity, evidence, and recovery across the application lifecycle.
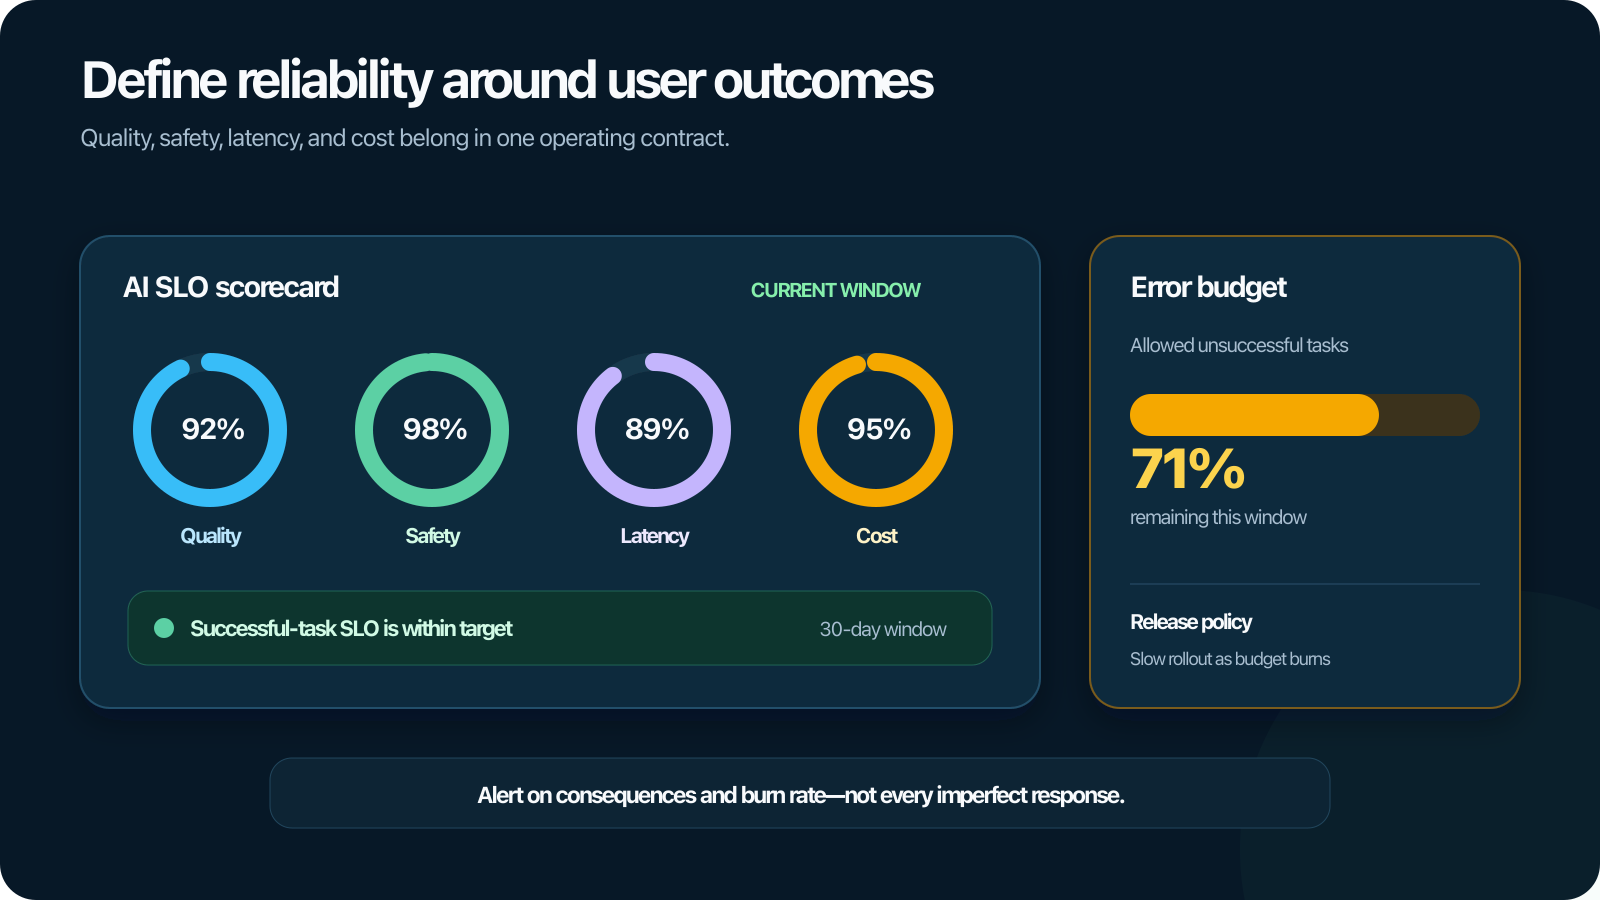
Define service-level objectives for AI quality, task success, safety, latency, availability, and cost using measurable user-centered indicators.
Measure Polyaxon agent workflow bottlenecks across planning, queueing, execution, transfers, and evaluation using critical-path timing and quality-aware comparisons.
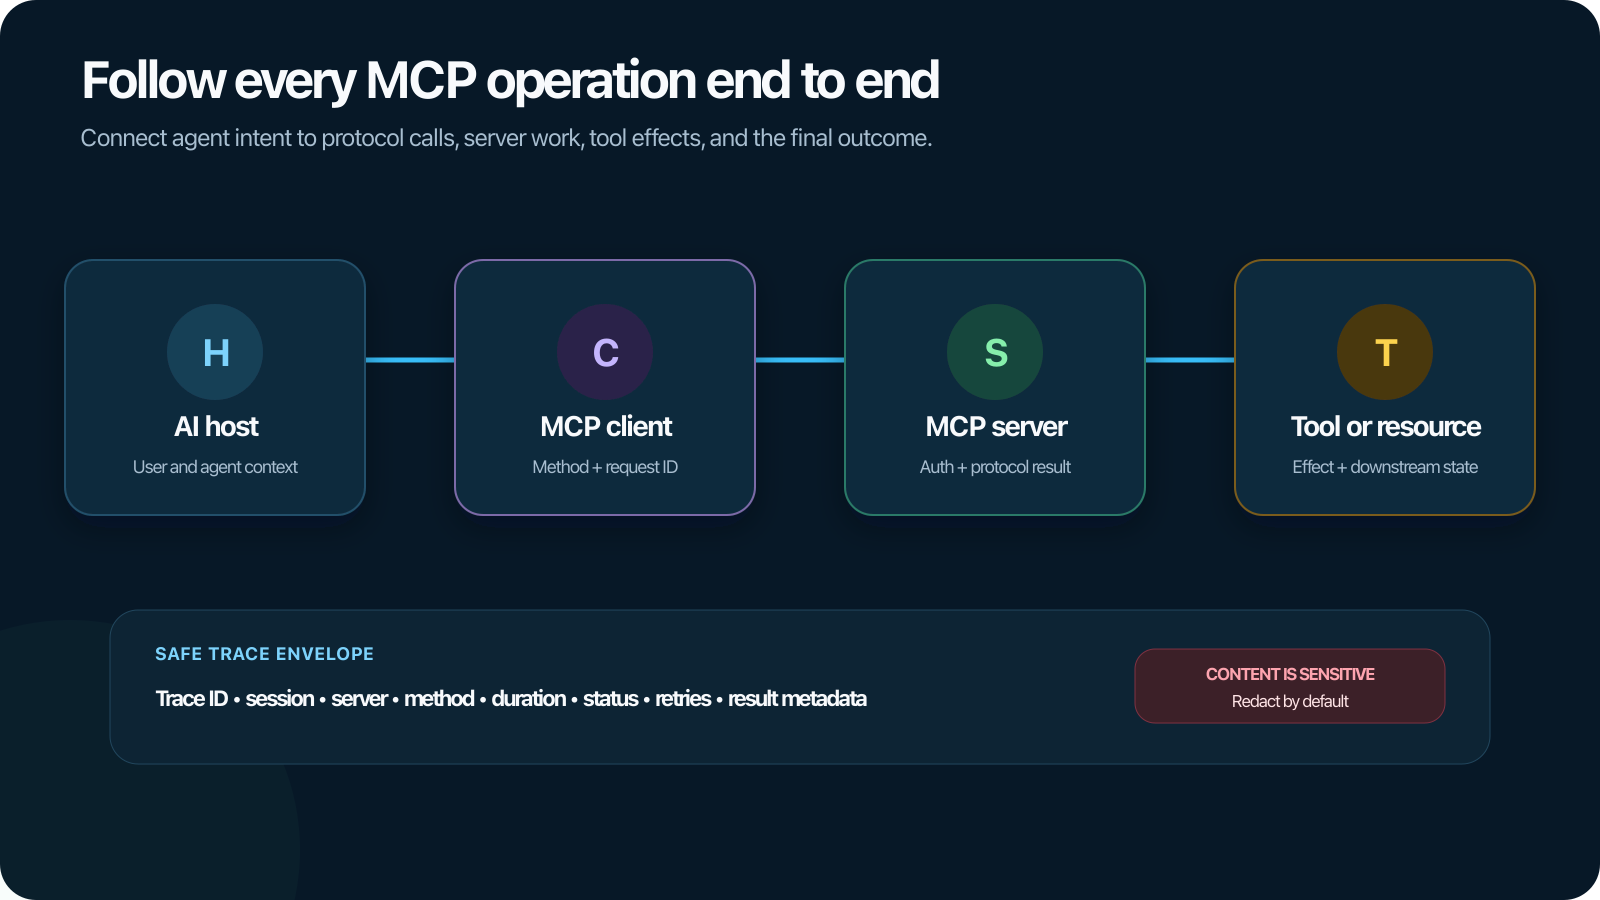
Trace MCP discovery, sessions, resources, prompts, tool calls, permissions, errors, and agent outcomes across clients and servers.
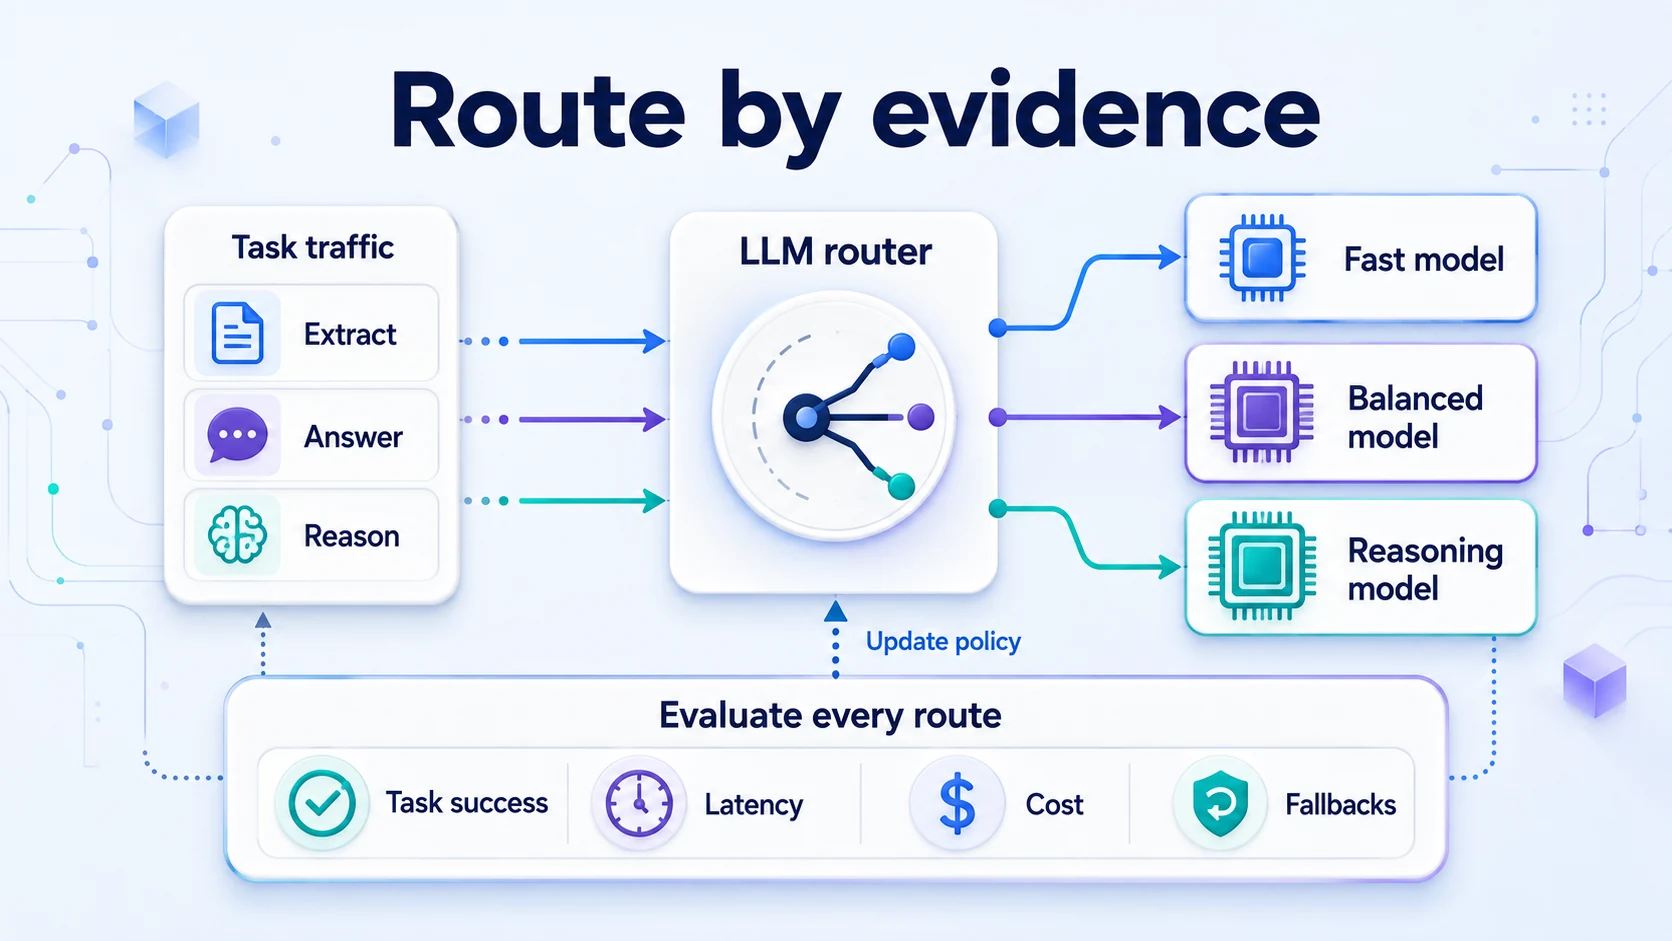
Test LLM routing policies with task-level quality, cost, latency, fallbacks, route stability, and model-aware production evidence.
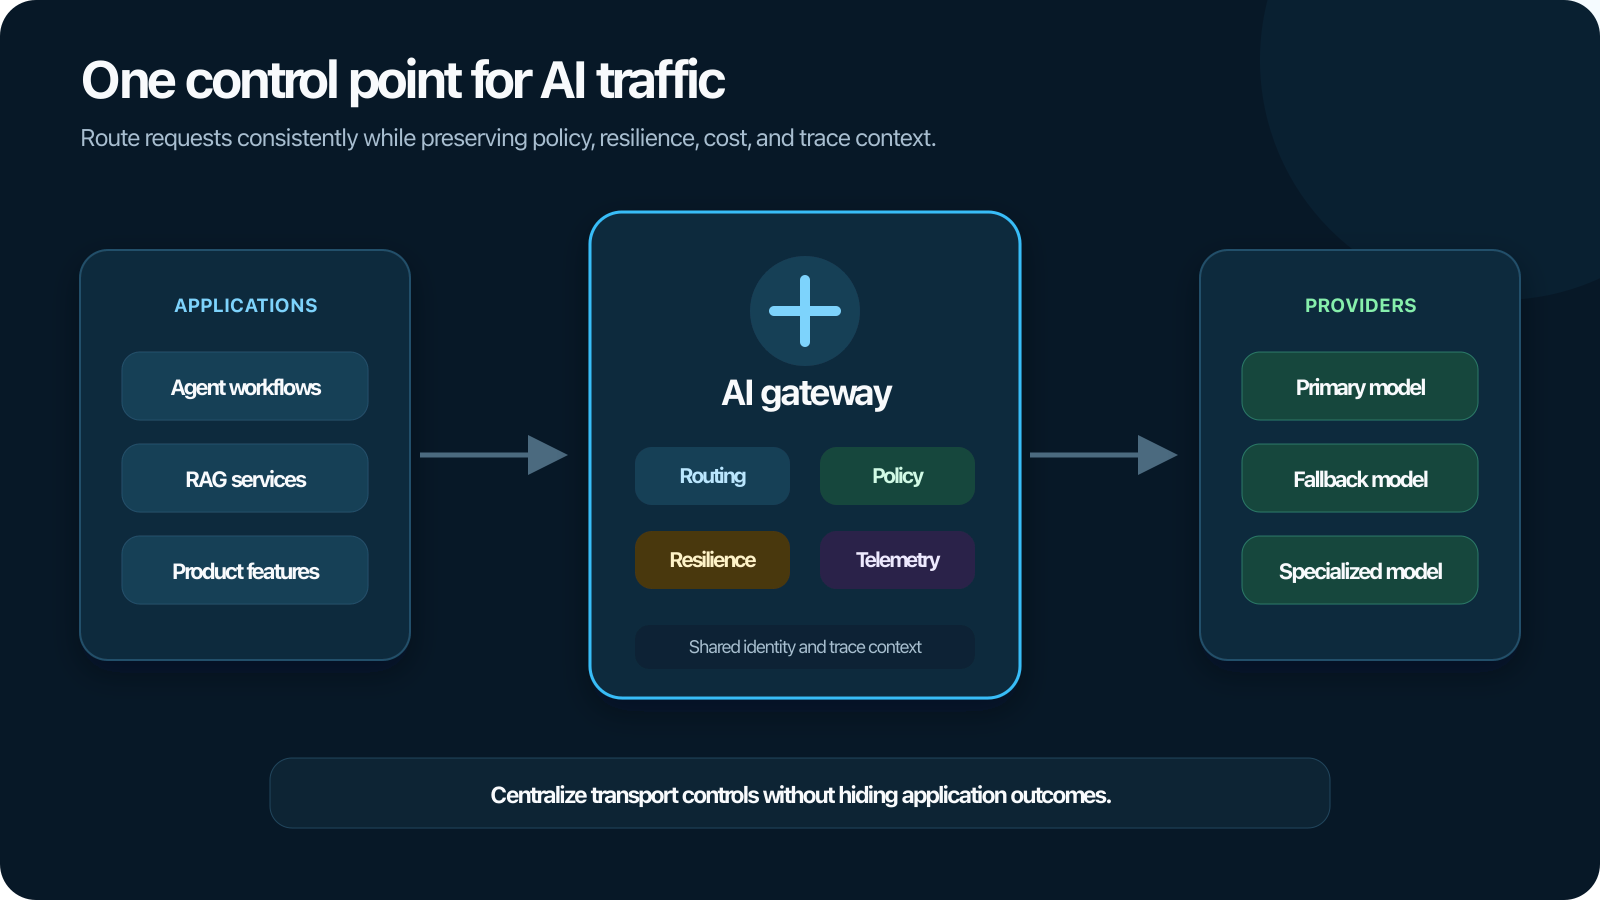
An AI gateway centralizes model access, routing, resilience, policy, cost controls, and telemetry across production LLM applications and agents.
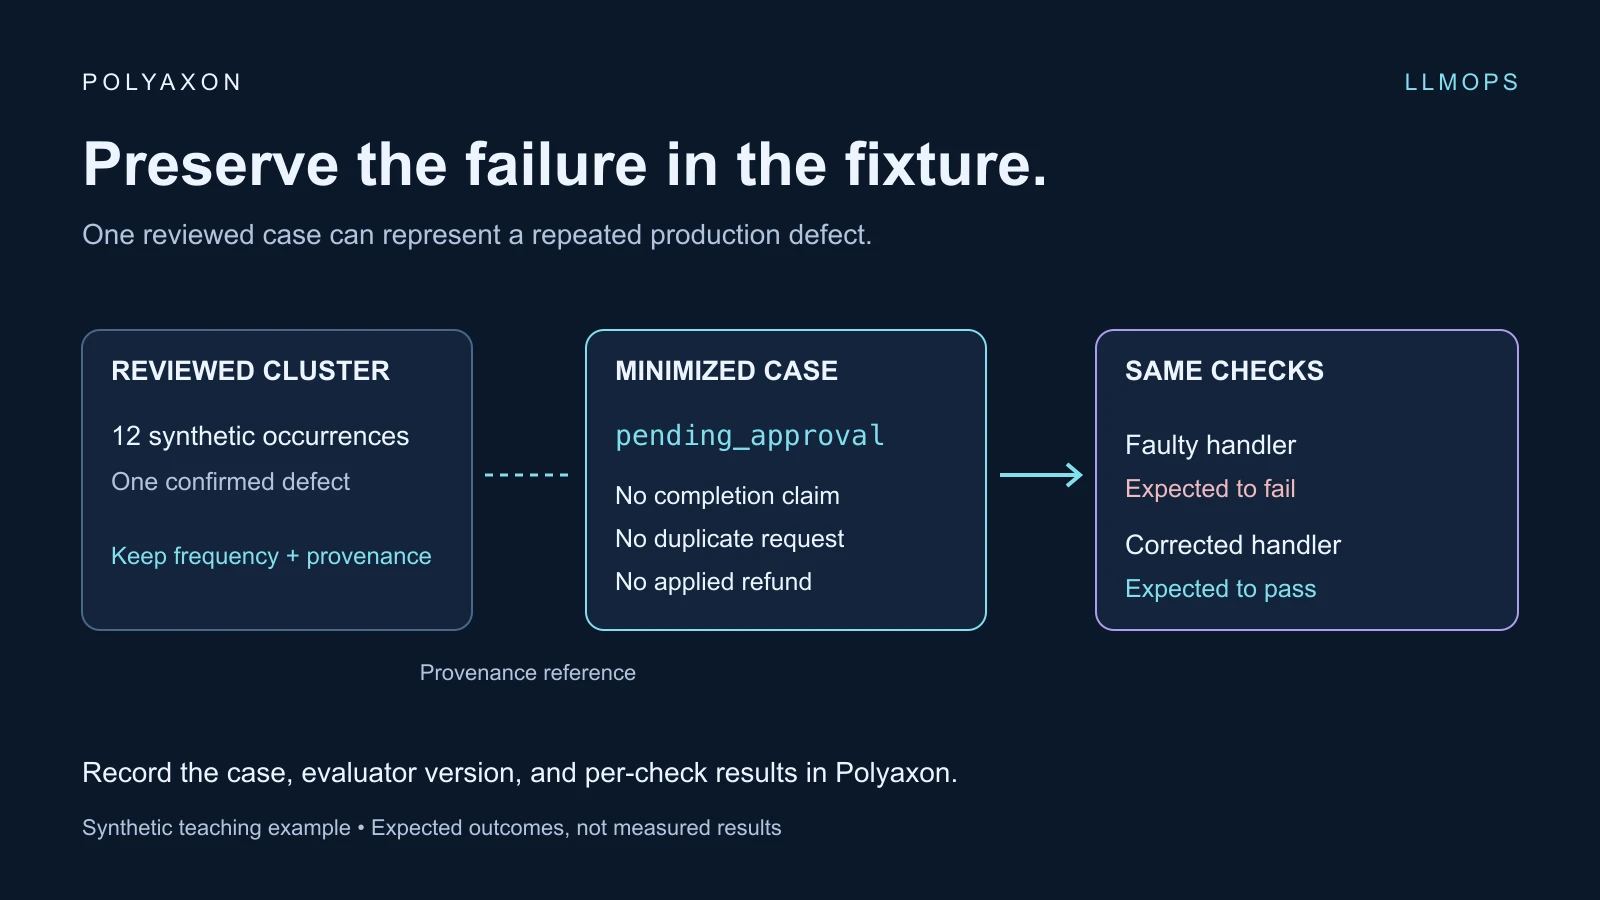
Turn a failure cluster into a reviewed regression case, preserve the causal tool response, and record baseline and candidate checks with Polyaxon.
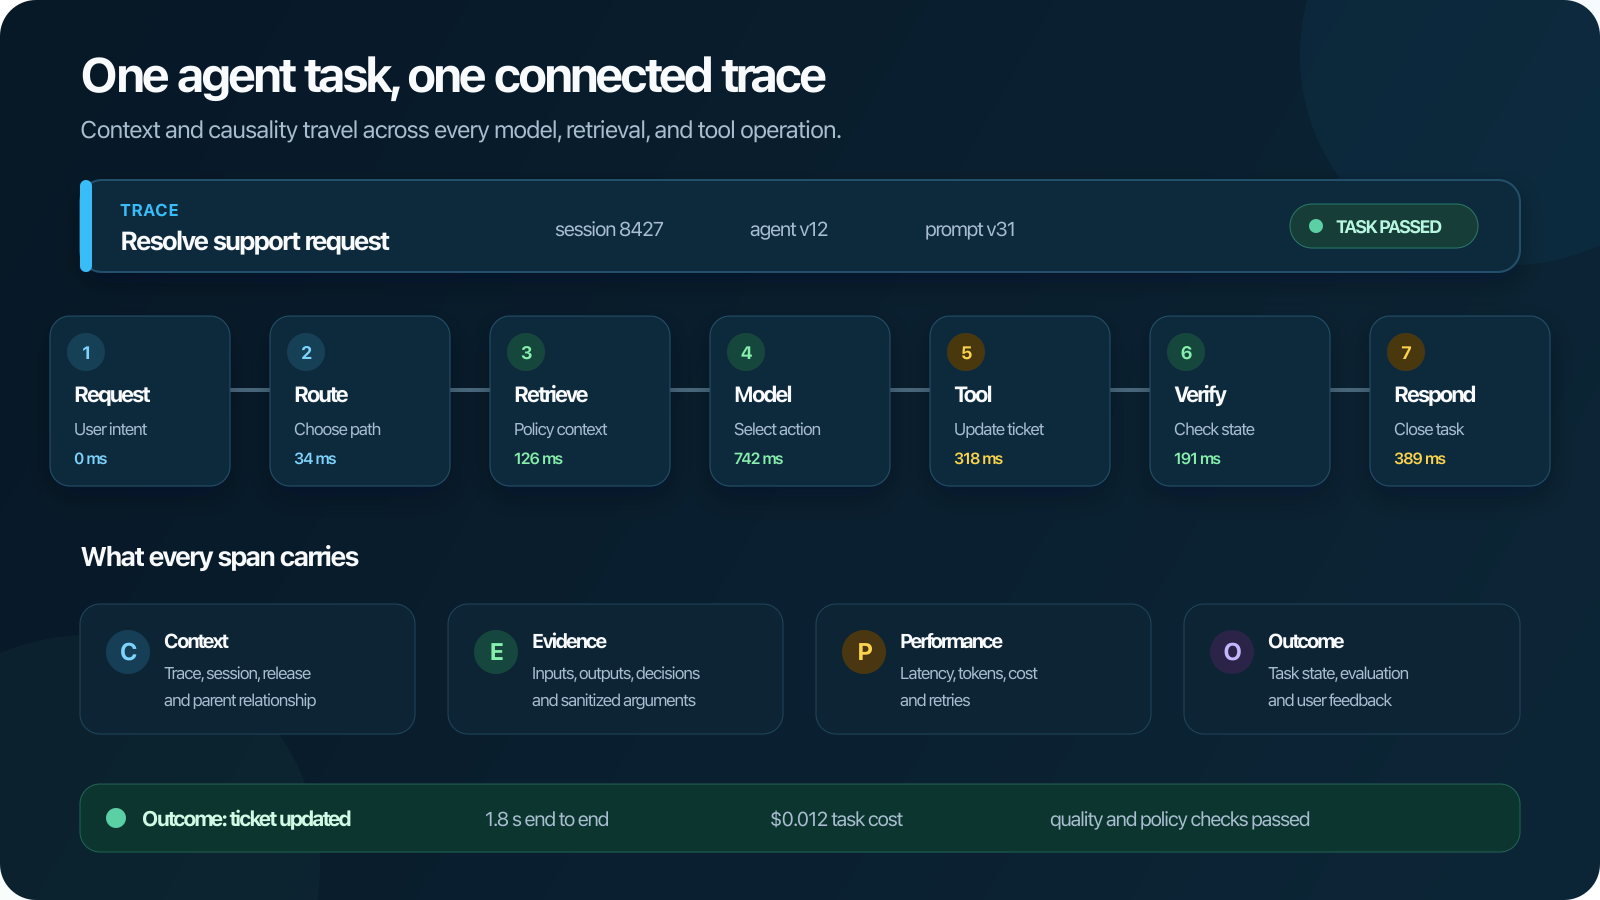
AI agent tracing connects model calls, retrieval, tools, state, and handoffs so teams can explain failures, latency, cost, and outcomes.
Use Polyaxon tracking, sandbox execution receipts, artifacts, and run comparison to investigate coding-agent failures and qualify changes.
Correlate Polyaxon run records with external runtime-security events to investigate agent workloads, preserve evidence, and coordinate containment.
Design OpenTelemetry Collector pipelines for ML services with clear receivers, processors, exporters, deployment patterns, and failure controls.
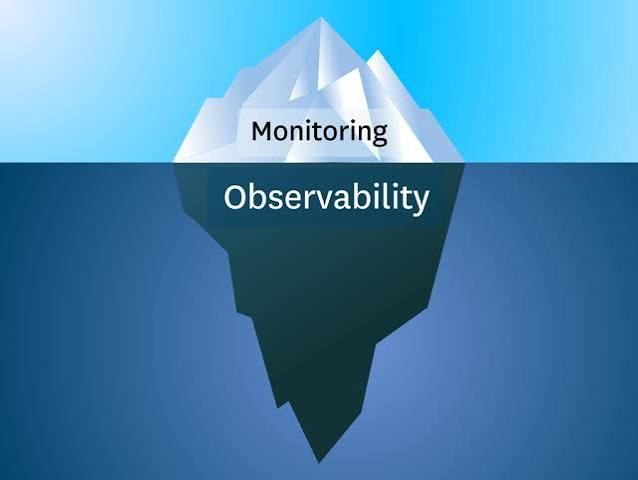
Separate monitoring from observability, then combine metrics, logs, traces, run context, and model evaluation into an effective ML operating model.

Understand how BPF Type Format supports eBPF introspection, CO-RE portability, safer deployment, and kernel-level observability for ML infrastructure.
Use OpenTelemetry automatic instrumentation as a safe baseline, then add domain spans, stable attributes, sampling, and rollout controls for ML services.
Trace ML requests and operations across APIs, queues, schedulers, storage, model services, and external tools without losing context or causality.
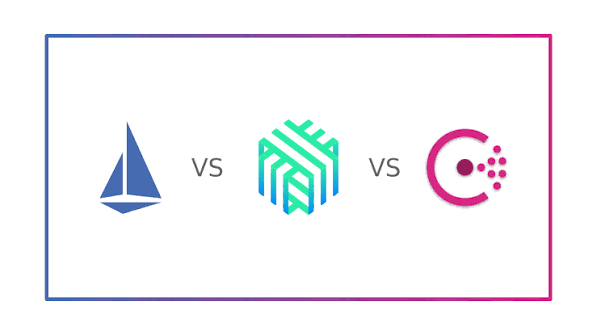
Compare Istio, Linkerd, and Consul service mesh architectures by workload scope, traffic policy, identity, observability, operations, and ML fit.
Instrument Java and Spring ML services with the OpenTelemetry agent, SDK, OTLP, domain spans, stable resource identity, and safe rollout controls.
Understand OpenTelemetry signals, APIs, SDKs, semantic conventions, OTLP, the Collector, and how they fit into an ML observability architecture.
Decide whether a service mesh fits your ML platform, then design traffic policy, identity, observability, rollout, and failure behavior deliberately.