What are your ML jobs connecting to?
Trace image pulls, Git clones, S3 and GCS access, Hugging Face downloads, and artifact uploads across the lifecycle of Kubernetes jobs and sandboxes.
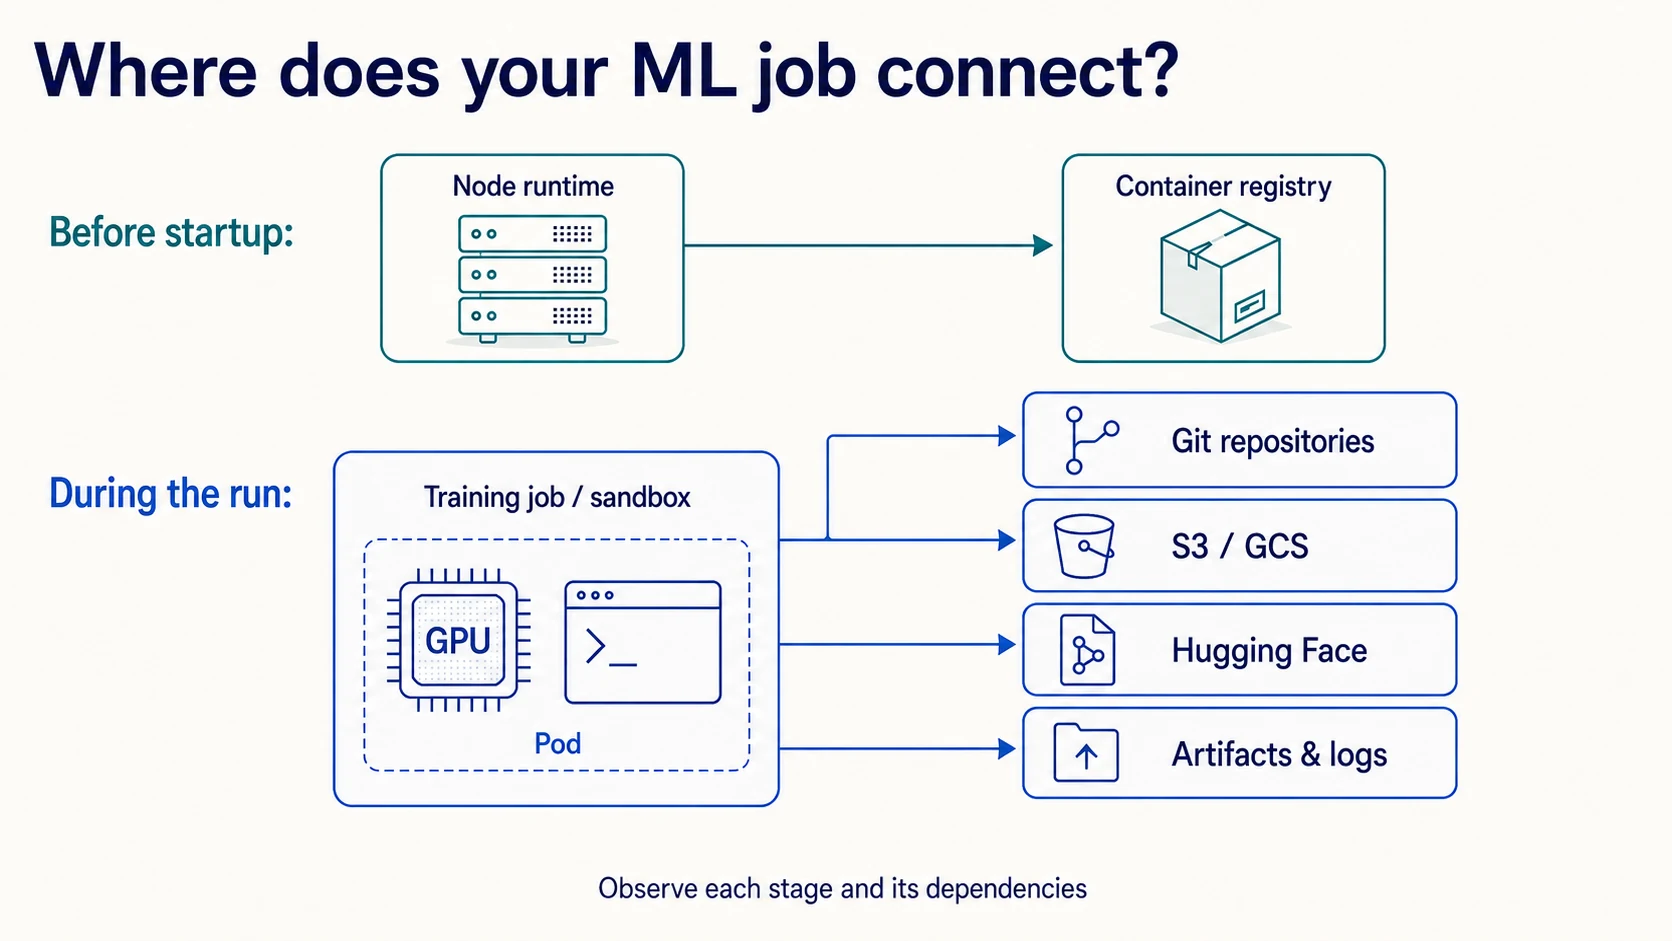
A training job may contact a container registry, clone a Git repository, download a dataset, fetch model weights, and upload checkpoints before it finishes. A sandbox adds interactive package installs and requests made by notebooks, terminals, or agents. These dependencies affect startup time, reliability, cost, and access to data.
When a run spends several minutes waiting, the GPU graph rarely explains the delay. You need to know which component made the request, which resource it needed, and whether it was resolving a name, authenticating, transferring data, or retrying. Start by mapping the workload's network activity to its execution stages.
Follow the request from the right component
Not every connection associated with a run originates inside its main container:
| Stage | Typical caller | Dependencies to investigate |
|---|---|---|
| Image build | A separate builder or CI job | Base-image registries, package indexes, source repositories |
| Image pull | Node container runtime, directed by the kubelet | Registry, authentication service, image blob storage |
| Initialization | Git or data initializers in the workload Pod | Git host, S3/GCS objects, model files |
| Execution | Training, evaluation, service, or sandbox process | Dataset shards, model APIs, databases, distributed peers |
| Output persistence | Application or configured artifact uploader | Checkpoint storage, logs, reports, model artifacts |
In Kubernetes, the kubelet and container runtime pull images before starting the relevant container. A Pod traffic view alone therefore does not account for the registry traffic needed to create that container.
Containers within a Pod share network resources. A connection attributed to a Pod may belong to an initializer, sidecar, or application process. Preserve the node, namespace, Pod UID, container name, and timestamps so you can distinguish those cases. Pod names and IP addresses alone are weak identifiers across retries and replacements.
Build a dependency inventory for one real run
Choose a representative training job or sandbox and list the resources it is expected to access. Include the operation, version, credential source, and time at which access is needed:
| Resource | Expected activity | Version or scope to record |
|---|---|---|
| Training image | Pull manifest and missing layers | Image digest and registry |
| Git repository | Fetch code and required submodules | Commit ID and repository |
| S3/GCS dataset | List or read required objects | Dataset manifest, object versions, permitted prefix |
| Hugging Face model | Fetch configuration, tokenizer, and weights | Repository and commit revision |
| Artifact storage | Write checkpoints and reports | Run-specific output location |
Also record supporting dependencies: DNS, credential exchange, Git LFS, package mirrors, and any proxies or private endpoints. A successful request to a service's homepage does not prove that its authenticated downloads work. Redirects and separate blob-serving endpoints may be part of the real path.
Use Polyaxon connections to make configured Git, registry, and storage access explicit. For sandboxes, attach the required secrets and connections through the run configuration or a preset. Connection configuration identifies intended access; it is not a complete inventory of every request application code can make.
Establish which stage is waiting
Start with the run status and workload events. With read access to the namespace, set these example variables to the actual Pod and main-container names:
RUN_NAMESPACE=ml-workloads
RUN_POD=training-pod-name
RUN_CONTAINER=main-container-name

kubectl get pod "$RUN_POD" -n "$RUN_NAMESPACE" -o wide
kubectl describe pod "$RUN_POD" -n "$RUN_NAMESPACE"
kubectl logs "$RUN_POD" -n "$RUN_NAMESPACE" \
  -c "$RUN_CONTAINER" --timestamps --tail=200
If the Pod is not scheduled, investigate placement and resource availability first. If it is scheduled but reports an image-pull error, inspect registry reachability and credentials from the node/runtime path. If an initializer is waiting or failing, inspect that container's logs. The main application may not have started yet.
Once execution begins, log boundaries such as dataset_download_started, model_download_finished, and first_batch_started. Record elapsed time, attempts, bytes transferred when available, and a sanitized resource identifier. Keep credentials, authorization headers, and signed URL query strings out of those records.
A completed training loop is also not proof that outputs were persisted. Track checkpoint or report upload completion separately, especially when cleanup and retries happen after the main computation.
Combine application evidence with network observations
Different observations answer different questions. Application logs identify the requested object and SDK error. DNS logs show name resolution. CNI flow records can reveal connection attempts and policy drops. Registry and cloud-storage logs can help explain authorization failures or throttling when the relevant logging is enabled.
For clusters already using Cilium with Hubble enabled, an accessible Hubble API, and the CLI configured, inspect the affected Pod:
hubble observe --pod "$RUN_NAMESPACE/$RUN_POD"
hubble observe --pod "$RUN_NAMESPACE/$RUN_POD" --verdict DROPPED
These filters follow Cilium's network flow inspection guide. They are an optional cluster observability path, not a Polyaxon requirement. Verify collection coverage and retention; an empty result can mean no retained observation rather than no network activity.
Correlate observations within the same run interval. A DNS answer does not prove that a connection succeeded, and multiple domains can share an IP address. Encrypted HTTP traffic does not reveal object paths or application errors to a basic network-flow observer. Destination byte counts can show a large transfer, but cannot establish which dataset version was read.
Keep source and destination identities before address translation where your tooling provides them. At a shared NAT gateway, aggregate traffic can combine many unrelated runs. Also check whether counters are cumulative or interval totals before adding them together, and whether sampled records can support the conclusion you want to draw.
Fix the repeated transfer or failed request
Use the inventory and timing evidence to choose a change:
| Observation | Investigation or change |
|---|---|
| Packages download whenever a sandbox opens | Move stable dependencies into the environment image; keep deliberate interactive changes visible |
| Every worker fetches the same model | Evaluate a cache or staged copy accessible to those workers, with explicit revision and permissions |
| Dataset reads dominate each training step | Inspect shard size, request concurrency, storage locality, and preprocessing |
| Requests repeatedly return authorization errors | Check the actual workload identity, resource scope, and credential refresh path |
| Many workers retry or time out together | Compare service limits, network capacity, and client concurrency before increasing retries |
| Output upload stalls after training | Check destination permissions, multipart upload behavior, timeouts, and completion handling |
For Hugging Face downloads, use a specific revision and configure a persistent cache when reuse is appropriate. A warm cache can reduce transfers, but test a new worker and an updated model too: they may exercise endpoints absent from the warm run.
Bound retries and preserve the underlying error. Repeatedly retrying a denied request can turn a clear access failure into an apparent performance problem. When evaluating regional placement or data-transfer costs, use the actual cloud account, endpoint path, and traffic records rather than treating all network bytes as billable internet egress.
Turn the inventory into tested access rules
After observing representative runs, define the network access they require. Kubernetes NetworkPolicy controls supported traffic through Pod, namespace, and IP/port rules, and requires a network plugin that enforces it. The core API does not provide a domain-name allowlist; FQDN policies depend on additional networking capabilities.
Account for DNS, identity services, artifact uploads, and the registry's separate node traffic path. Review node egress controls with the platform team. Test new workloads after policy changes, including cold caches and credential renewal. Observing a destination once is a reason to investigate its purpose, not automatically a reason to allow it permanently.
Keep network reachability and resource authorization separate. Allowing HTTPS to object storage does not grant or restrict access to a particular bucket prefix; that also requires the storage service's identity and permission controls. Polyaxon's sandbox networking guide describes how outbound access depends on the cluster and its policies.
Keep the evidence with the run
Save a sanitized dependency manifest and timing report alongside the run's other artifacts. Include code and image revisions, dataset and model versions, the time window, and references to retained network observations. This lets a later comparison distinguish a faster model from a warmer cache or a different data path.
Polyaxon provides the run, configuration, logs, and artifact context. Combine that context with the network telemetry available in your cluster and storage systems. Start with one workload, resolve its largest unexplained wait, and repeat the measurement after the change. The resulting dependency map becomes useful for the next training run, replacement worker, and sandbox session as well.