Connect LLM production traces to evaluation runs
Keep release, dataset, evaluator, and sampling context connected as you investigate LLM failures and compare fixes with Polyaxon.
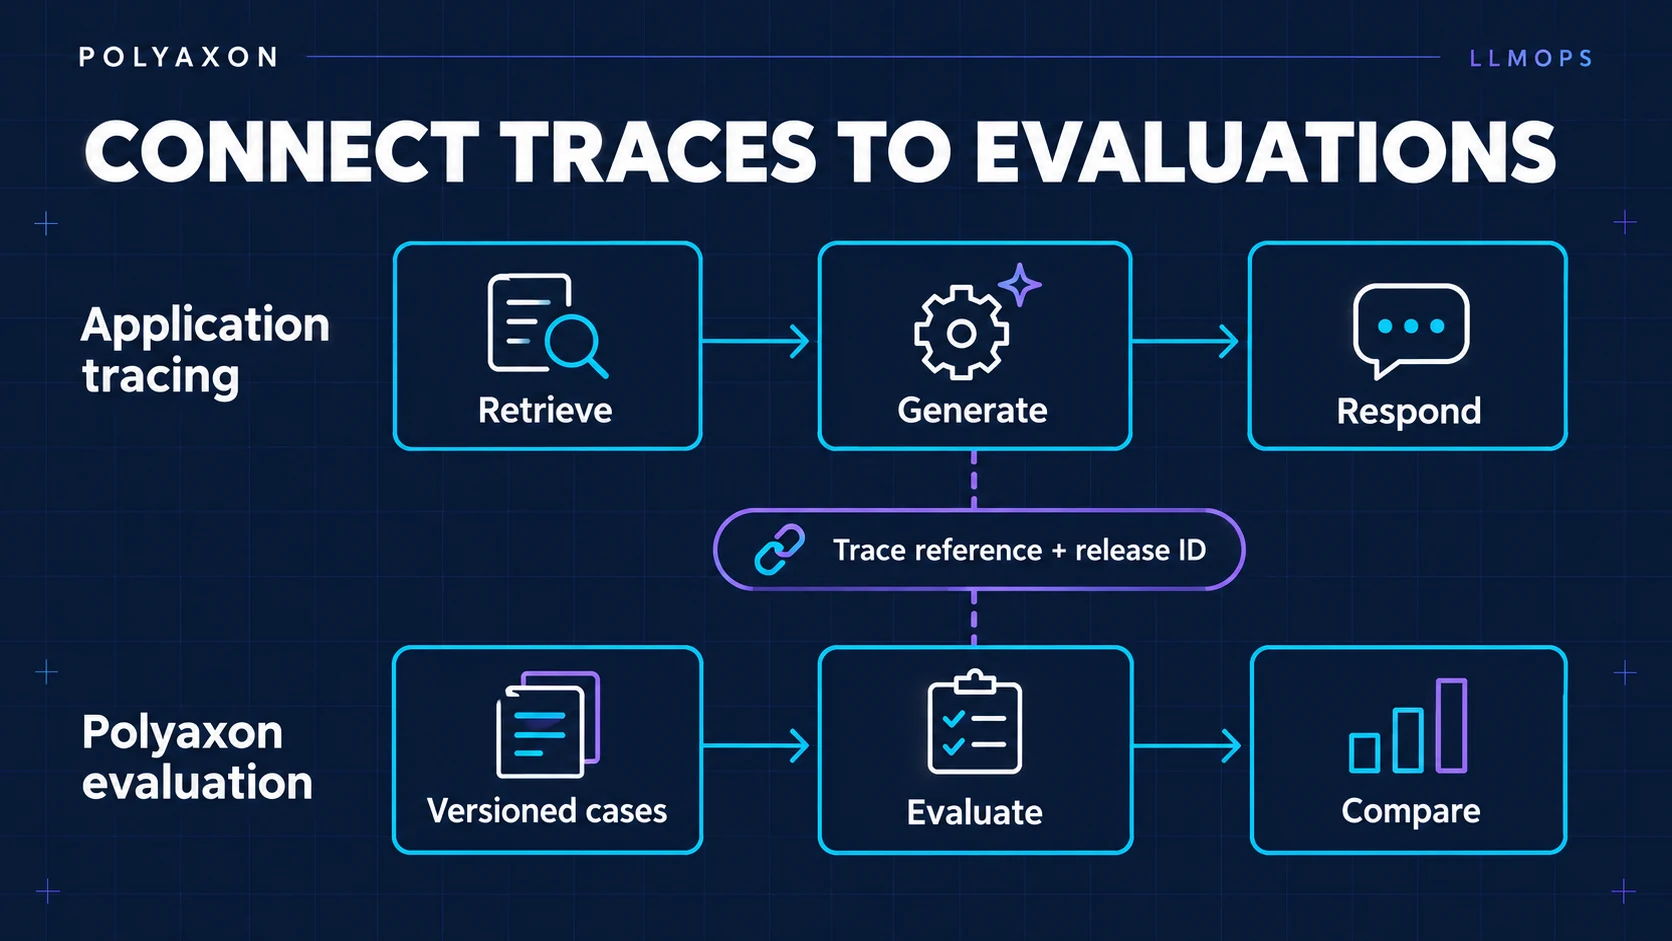
Conceptual workflow: the trace reference connects records; your application controls case selection and evaluation.
A support assistant starts citing an outdated policy. The request completed, the model returned an answer, and the service stayed within its latency target. The trace shows which documents reached the model. Your evaluation dashboard says the latest prompt performs well. Yet neither view explains whether that score covers the policy revision involved in the failure.
The missing piece is the connection between those records. A useful LLMOps observability workflow preserves the application release, retrieved evidence, evaluation cases, and scoring rules as an investigation moves between production and offline runs.
You can build that connection with your application's tracing system and Polyaxon's tracking, artifacts, and run comparisons. The application supplies traces and evaluators; Polyaxon records and organizes the evaluation workloads and their results.
Give each record a clear job
A trace describes the work performed for a request. In OpenTelemetry, spans carry timing, attributes, and relationships to other spans, with a trace ID connecting them. That structure helps locate a slow retrieval call or a failed dependency. It does not, by itself, establish that an answer used the correct policy. OpenTelemetry traces
Use complementary records for different questions:
| Record | Question it should answer |
|---|---|
| Application trace | Which retrieval, model, and tool operations happened? |
| Application release manifest | Which code, prompt, model configuration, and retrieval snapshot were intended? |
| Evaluation case | What input, evidence, and expected behavior should be exercised? |
| Polyaxon evaluation run | Which candidate and evaluator ran, and what did they produce? |
| Case report | Which cases passed, failed, or could not be evaluated? |
Keep the original production trace in its tracing backend. Put its reference into the sanitized case record, and retain that case record with the evaluation output. A trace ID and a Polyaxon run UUID identify different things; record their relationship explicitly.
For agents, also preserve the task ID and execution attempt. One logical task may involve retries or multiple requests. The agent tracing guide covers those relationships in more detail.
Carry versions across the boundary
Start the policy investigation with the affected release and the document revision actually retrieved. A document identifier alone is insufficient when its contents can change. Preserve a reviewed snapshot or a reference that resolves to the required revision.
When the incident becomes an evaluation case, distinguish the original release from the candidate being evaluated. Replaying the case against a new prompt should create a new result, while its production provenance stays intact.
Record the case-set revision, evaluator revision, and candidate configuration together. Include the model identifier used, inference settings, prompt revision, retrieval configuration, and code or container revision. If a provider exposes a resolved model version, retain it alongside the requested identifier. Recording a mutable alias does not freeze its behavior.
Polyaxon tracking inputs can hold the revisions used by a run. Keep the complete manifest and per-case evidence as artifacts, so the comparison table stays readable. The prompt-versioning guide explains how to preserve the prompt side of this record.
Choose what to retain and what to evaluate
Trace retention and evaluation selection are separate decisions. You may retain detailed traces for slow or failed requests while evaluating a representative sample of ordinary traffic. Write down both policies.
OpenTelemetry distinguishes early, head-based sampling from tail sampling that considers more of a completed trace. Tail sampling can select traces using errors or latency, but it requires additional processing and cannot recover data already discarded upstream. OpenTelemetry sampling
An error-focused collection is useful for diagnosis. Its acceptance rate is not the application's overall acceptance rate. Label that collection as an incident set, keep a representative sample for broader quality estimates, and record the source window, selection method, and evaluated counts.
Also distinguish a rejected answer from an evaluation error. An unavailable judge or missing fixture leaves the result unknown. Count those cases and make the gap visible instead of calculating a better-looking score from the cases that happened to finish.
Retain content deliberately. A trace reference, document revision, and failure category may be enough for routine reporting; reproduction may need a separately protected fixture. Inspect instrumentation defaults and minimize prompt, document, and tool payloads before exporting them. OpenTelemetry's sensitive-data guidance describes this responsibility and the available filtering and redaction mechanisms.
Record an evaluation report in Polyaxon
Suppose your evaluator writes a JSON report containing:
configuration:application_release,dataset_revision,evaluator_revision, andselection_policy.expected_case_ids: the unique IDs selected before evaluation begins.cases: one record per expected ID, withcase_id,status, and any approved trace reference or diagnostic detail. Useaccepted,rejected, orerrorforstatus.
This is an application-owned report format. Your evaluator decides acceptance and writes an error record when a case cannot be assessed. The adapter below records that report; it does not call a model or evaluate an answer.
Run it inside an existing Polyaxon job with the client installed, tracking configured, and artifact collection enabled. Pass the sanitized report path as its argument, for example python record_evaluation.py results.json.
import json
import sys
from collections import Counter
from pathlib import Path

from polyaxon import tracking
from polyaxon.schemas import V1ArtifactKind

report = json.loads(Path(sys.argv[1]).read_text(encoding="utf-8"))
cases = report["cases"]
expected = report["expected_case_ids"]
case_ids = [case["case_id"] for case in cases]
statuses = Counter(case["status"] for case in cases)

if (
    not expected
    or len(set(expected)) != len(expected)
    or len(set(case_ids)) != len(case_ids)
    or set(case_ids) != set(expected)
    or set(statuses) - {"accepted", "rejected", "error"}
):
    raise ValueError("Require one valid result for every expected case")

config = report["configuration"]
tracking.init()
tracking.log_inputs(
    application_release=config["application_release"],
    dataset_revision=config["dataset_revision"],
    evaluator_revision=config["evaluator_revision"],
    selection_policy=config["selection_policy"],
)
tracking.log_metrics(
    cases_total=len(expected),
    cases_accepted=statuses["accepted"],
    cases_rejected=statuses["rejected"],
    cases_error=statuses["error"],
    accepted_fraction=statuses["accepted"] / len(expected),
)
tracking.log_outputs(evaluation_complete=statuses["error"] == 0)

path = Path(tracking.get_outputs_path("evaluation/report.json"))
path.write_text(json.dumps(report, indent=2), encoding="utf-8")
tracking.log_artifact_ref(
    path=str(path), kind=V1ArtifactKind.FILE, name="evaluation-report"
)
Here, accepted_fraction uses every selected case as its denominator, including evaluation errors. It measures confirmed acceptance across that selection; inspect cases_error before interpreting a decrease as worse application quality. evaluation_complete says every case was assessed, not that every answer passed.
The file is explicitly written under the run's outputs directory. log_artifact_ref() registers its lineage reference; that call does not fetch production traces or upload an arbitrary external file. These behaviors are documented in the tracking API and artifact guide.
Compare candidates on the same evidence
For the policy incident, evaluate the current release and the proposed fix against the same cases and evaluator. Keep the retrieval snapshot fixed if you are testing a prompt change. If the fix changes retrieval, record both snapshots and explain that the experiment changes that part of the system.
In run comparison, filter to the same dataset, evaluator, and selection policy. Display candidate release, accepted and rejected counts, evaluation errors, and any measured latency or usage metrics. Open the case reports to check whether an apparent improvement fixes the original failure and preserves previously accepted behavior.
Polyaxon v2.14 added synchronized chart cursors, shared brush selection, and richer multi-run comparison views. These help inspect related measurements, but meaningful comparison still depends on consistent inputs and metric definitions. Record application latency separately from evaluator runtime, and evaluator usage separately from application usage.
Package repeatable evaluation logic as a versioned component. When preparation, candidate execution, and reporting need separate workloads, connect them with a DAG and explicit artifact inputs. The production-trace regression guide covers case creation and maintenance.
Make the next investigation easier
Start with one real failure and follow its records in both directions: from the production trace to the selected case, and from the candidate's result back to its configuration and evidence. Fill in missing revisions or ambiguous outcomes before expanding the dashboard.
The useful result is a comparison you can explain: what changed, which cases it improved, what remains uncertain, and which production signal should confirm the improvement after release. Keep that relationship intact as the application evolves.