MCP observability: Monitor tools, resources, and context
Trace MCP discovery, sessions, resources, prompts, tool calls, permissions, errors, and agent outcomes across clients and servers.
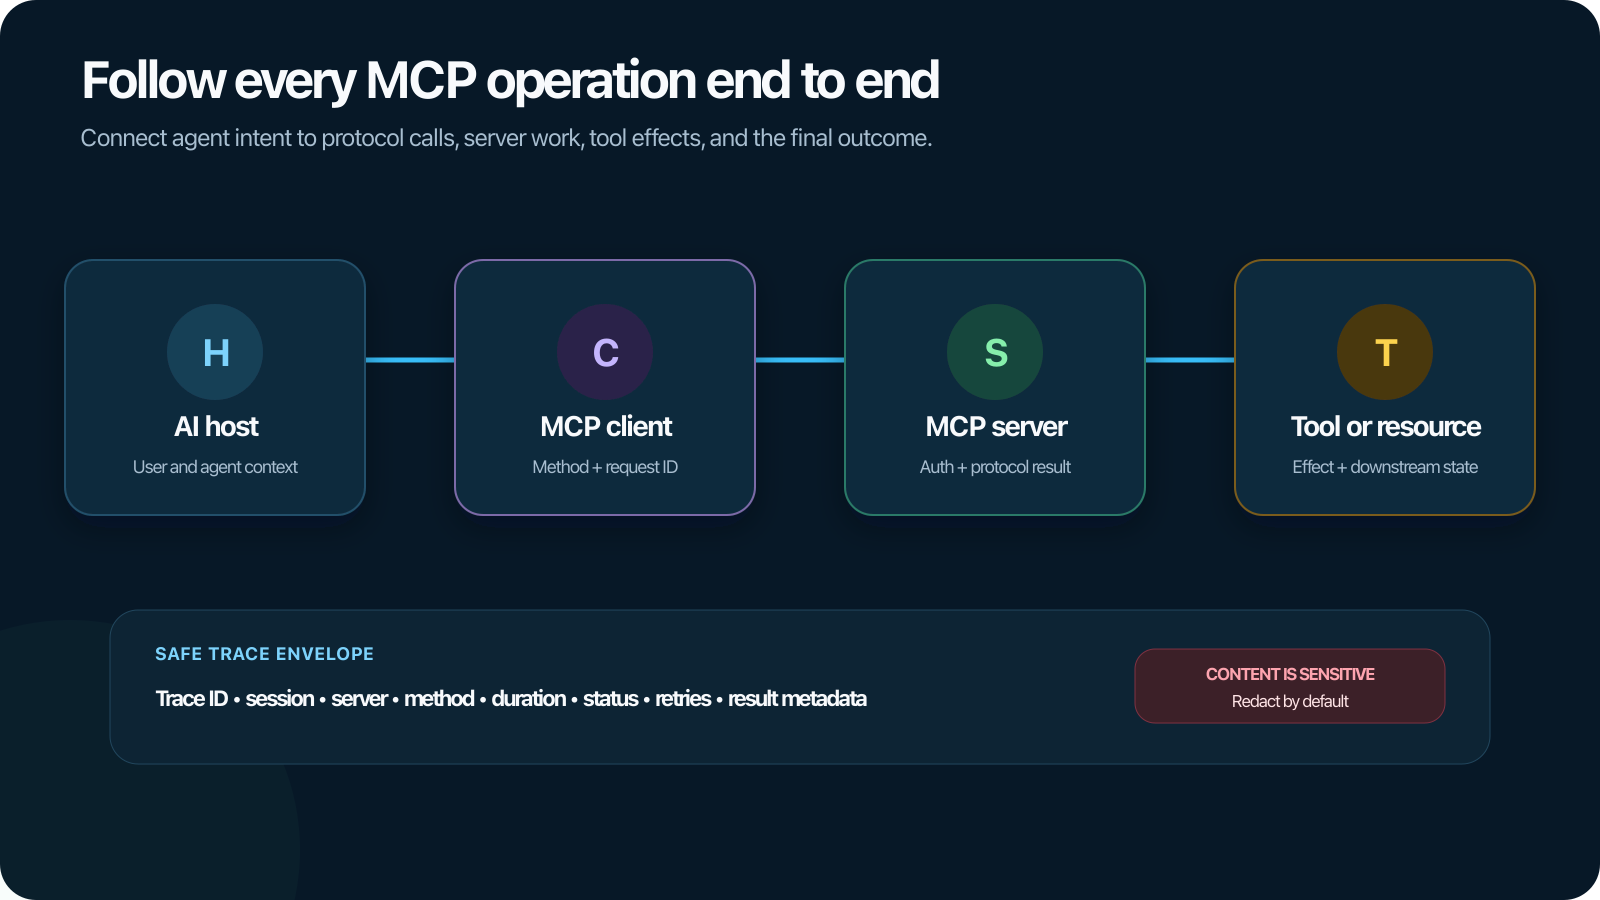
The Model Context Protocol gives AI applications a standard way to discover and use tools, resources, and prompts exposed by external servers. That standard interface reduces integration work, but it does not make the resulting agent behavior automatically observable.
An MCP request can fail at discovery, transport, authorization, argument construction, server execution, result interpretation, or the surrounding agent decision. MCP observability connects those layers so teams can identify where the failure originated and what the user experienced.
What is MCP observability?
MCP observability is the practice of collecting and correlating telemetry across MCP hosts, clients, servers, protocol operations, tool execution, resource access, and the AI application or agent that initiated them.
It should answer:
- Which client and server versions participated in the session?
- What capabilities, tools, resources, and prompts were advertised?
- Which operation did the application request, with what sanitized arguments?
- Was the request authorized and approved?
- How long did transport, server processing, and underlying work take?
- Did cancellation, progress, retry, or reconnection behave correctly?
- Which model decision triggered the MCP tool call?
- Did the result contribute to a successful user task?
The MCP specification defines the protocol's capabilities and utilities, including logging, progress, cancellation, and error reporting. Observability connects those protocol events with traces, metrics, application versions, and outcomes.
Understand the MCP execution boundary
An MCP interaction commonly includes:
- A host runs an AI application.
- An MCP client connects to a server.
- The client and server initialize and negotiate capabilities.
- The client lists or retrieves tools, resources, or prompts.
- A model or application selects an operation.
- The client sends the protocol request.
- The server authorizes and executes underlying work.
- Progress, logs, errors, or a result return.
- The agent interprets the result and continues the task.
Instrument both the protocol boundary and the underlying operation without double-counting. A tool execution may already have an agent span; MCP attributes can enrich it or connect a client/server span pair.
Why ordinary API telemetry is incomplete
HTTP or process metrics can show that bytes moved successfully while the agent still failed because:
- The server advertised an outdated tool schema.
- The client selected a tool the user did not authorize.
- Required context or roots were unavailable.
- Prompt arguments used the wrong variable.
- A resource URI resolved to stale or prohibited data.
- Cancellation reached the transport but not the underlying job.
- The server returned a valid result that the agent misinterpreted.
- A reconnect created duplicate execution.
MCP-specific context makes these states visible. End-to-end agent context shows whether they mattered to the task.
Trace the complete MCP path
Session and capability negotiation
Record host, client, server, protocol, and transport versions; session identity; supported capabilities; initialization latency; and connection or reconnection outcome.
Avoid using raw high-cardinality capability payloads as metric dimensions. Store a version, hash, or controlled inventory artifact and link it from the trace.
Discovery operations
Trace tool, resource, and prompt listing or retrieval. Record the server, method, inventory version, result count, pagination, latency, cache status, and error.
Discovery changes can alter agent behavior without an application deployment. Preserve the inventory or schema version resolved for the task.
Tool calls
Capture:
- Tool name, server, and schema version.
- Tool-call identifier and the model or routing decision that triggered it.
- Sanitized argument shape and validation result.
- Consent, authorization, and policy decision.
- Client transport and server processing latency.
- Underlying service or operation trace.
- Result status, size, content type, and sanitized summary.
- Retry, cancellation, and duplicate-execution status.
- Result interpretation and task outcome.
Tool arguments and results can contain credentials, personal data, source code, or customer records. Make full content opt-in and apply redaction before export.
Resource access
Record the resource URI or a protected identifier, server, template, version, MIME type, size, freshness, permission decision, cache status, and latency.
Do not expose secrets or user-specific resource paths in broadly accessible telemetry. Hash or categorize identifiers where direct values are unnecessary.
Prompt operations
Capture the prompt name and version, sanitized variables, message count, result size, server, and latency. Connect the returned prompt content with the application prompt composition and final model span.
Prompt variables may be sensitive. Treat them as protected content, not ordinary low-risk attributes.
Progress, logging, and cancellation
Protocol progress and logging messages provide useful evidence but should correlate with trace and task identifiers. Record whether cancellation was requested, acknowledged, propagated to underlying work, and completed within the expected time.
A cancelled client request that leaves an expensive server job running is an operational failure even if the protocol connection closes cleanly.
A practical MCP trace model
| Span or event | Important context |
|---|---|
| Agent or task span | Application, agent, session, release, task, and outcome |
| Model decision span | Model, prompt version, available tools, selected tool-call ID |
| MCP client span | Method, server, session, request ID, transport, latency, status |
| MCP server span | Method, server version, authorization, processing, error |
| Tool-execution span | Tool, schema, arguments policy, underlying operation, result |
| Resource span | URI or protected ID, version, permission, size, freshness |
| Evaluation event | Tool correctness, policy, task success, or result quality |
OpenTelemetry's developing MCP semantic conventions describe MCP client and server spans and compatibility with generative AI tool-execution spans. Because these conventions remain in development, record the instrumentation and schema version and expect migration.
Preserve causality between model and tool
A useful trace must show which model output or routing decision triggered a tool execution. Timing alone is unreliable when calls run concurrently or span boundaries do not overlap.
Preserve the tool-call identifier and use parent-child context or span links where appropriate. For delegated or asynchronous execution, record an explicit relationship between the decision, MCP operation, and underlying tool work.
This causality supports questions such as:
- Did the model select the wrong tool?
- Did the client invoke a different tool than requested?
- Did the server execute the correct operation?
- Did the agent use the result from the intended call?
- Was a repeated call a retry, loop, or duplicate?
Observe consent, authorization, and policy
MCP tools can expose arbitrary data access and code execution. The protocol specification emphasizes user consent, control, data privacy, and tool safety.
Record the decision without exposing sensitive policy inputs:
- Principal or protected user identity.
- Requested capability and target.
- Policy and permission version.
- Consent requirement and decision.
- Approval actor or mechanism.
- Scope, limits, and expiration.
- Denial or escalation reason category.
Do not treat a tool description from an untrusted server as authorization. Validate server identity, tool schema, allowed operations, and user permission through controlled policy.
MCP metrics that support operations
Derive bounded metrics from traces and protocol events:
- Active and failed sessions by client/server version.
- Initialization and discovery latency.
- Tool, resource, and prompt operations by method and server.
- Client and server error rate by controlled error category.
- Tool validation, authorization, and denial rate.
- Retry, reconnection, cancellation, and duplicate-execution rate.
- Tool duration and result size by tool and version.
- MCP operations per successful agent task.
- Cost and latency contribution to the complete task.
- Evaluation pass rate by server, tool, and application release.
Keep session IDs, request IDs, resource URIs, and user identifiers out of metric labels.
Debug common MCP failures
The tool is missing
Inspect initialization and discovery traces. Compare capability negotiation, inventory version, pagination, permissions, cache, and server release.
Arguments are rejected
Compare the tool schema advertised to the model with the schema validated by the server. Check prompt or adapter versions and record the validation error category.
The call succeeds but the agent fails
Follow the result into the next model or workflow span. The server may have returned correct data that was truncated, transformed, or interpreted incorrectly.
Cancellation does not stop work
Trace the cancellation from host to client, server, and underlying operation. Measure acknowledgement and actual termination separately.
A tool executes twice
Compare protocol request IDs, tool-call IDs, retry policy, reconnection, and server idempotency. Determine whether the duplicate came from the model, client, gateway, or server.
Latency is high
Separate client queueing, transport, server processing, downstream service time, and agent waiting. Progress notifications can show that work continues but do not replace timing spans.
Implement MCP observability incrementally
- Define the task, session, and trace boundaries.
- Propagate trace context through the host, MCP client, server, and underlying operations.
- Record versions for the application, client, server, protocol schema, tools, resources, and prompts.
- Instrument initialization, discovery, tool, resource, prompt, cancellation, and error paths.
- Attach authorization and consent decision metadata.
- Make sensitive content capture opt-in with redaction and retention controls.
- Connect model decisions to tool-call IDs and execution spans.
- Attach evaluation and task outcomes.
- Derive bounded metrics and alerts from trace data.
- Add confirmed failures to regression tests and protocol compatibility suites.
Common MCP observability mistakes
Instrumenting only the server
Client discovery, model selection, consent, transport, and result interpretation may contain the defect. Trace end to end.
Recording raw arguments and resources by default
These fields can be highly sensitive. Separate metadata from content and redact before export.
Losing the tool-call relationship
Connect the model decision, MCP request, server execution, and returned result explicitly.
Treating protocol success as task success
A valid JSON-RPC response does not show that the right tool ran or the user goal was achieved. Attach evaluation and outcome.
Creating duplicate spans
Coordinate MCP and agent instrumentation so the same tool execution is not counted twice. Enrich or link existing spans when appropriate.
Depending on unstable field names without versioning
MCP and OpenTelemetry conventions continue to evolve. Record schema and instrumentation versions and test migrations.
Polyaxon and the MCP-observability roadmap
Polyaxon's tracking, orchestration, and platform-observability capabilities provide a foundation for versioned AI workflows and infrastructure operations.
Full OpenTelemetry-compatible LLM and agent observability is an active area on the Polyaxon roadmap, alongside evaluations, an AI gateway, prompt management, and agent sandboxing.
The direction is to connect MCP client and server spans with model decisions, tool execution, application versions, policies, cost, and task outcomes in one trace.
Observe the protocol and the agent outcome
MCP standardizes how applications connect to tools and context. Observability must explain how those protocol operations contributed to an agent decision and a user result.
Trace discovery, permissions, calls, resources, prompts, progress, and cancellation across both client and server. Preserve causality and versions, protect content, and attach the final outcome using the same principles as AI agent tracing. That turns an integration protocol into an operable production dependency.
Use that evidence in MCP security testing to verify authorization, session identity, approval boundaries, and the effects of untrusted tool content. The security tests define which actions should be allowed; the trace and downstream service records establish what happened.