Monitoring vs. observability for ML systems
Separate monitoring from observability, then combine metrics, logs, traces, run context, and model evaluation into an effective ML operating model.
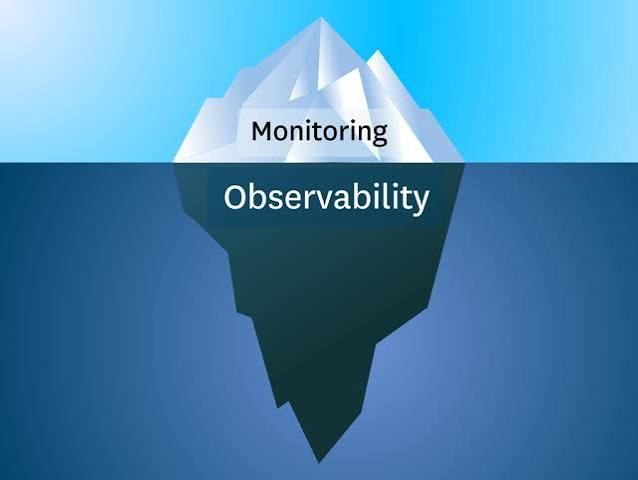
Monitoring tells you whether selected conditions are happening. Observability gives you enough evidence to investigate states you did not predict in advance.
They are complementary, not competing product categories. Monitoring turns known failure modes and objectives into dashboards and alerts. Observability makes the underlying system explainable when those alerts fire—or when users report a problem that no alert anticipated.
Start with the questions
The OpenTelemetry observability primer frames observability as the ability to understand a system's internal state through the data it emits. A useful practical distinction is:
| Practice | Example question |
|---|---|
| Monitoring | Is API error rate above the service objective? |
| Observability | Which dependency, release, request path, and workload class explain the errors? |
| Monitoring | Are training jobs waiting longer than the agreed threshold? |
| Observability | Is the delay caused by quota, fragmentation, data locality, image pulls, or scheduler policy? |
| Monitoring | Did model quality fall below an acceptance threshold? |
| Observability | Which data, code, parameters, prompt, retrieval context, or model version produced the change? |
Monitoring requires a definition of normal and a response when it is violated. Observability requires correlated, queryable evidence with enough context to form and test new hypotheses.
Collect signals that explain one another
Metrics summarize behavior over time and support efficient alerting. Logs preserve discrete events and detailed context. Traces connect work across services and show causality along a request path. Profiles explain where a process spends compute resources. Kubernetes events and object status expose control-plane decisions.
ML systems add another evidence layer:
- dataset and artifact versions;
- source code and container image;
- parameters, environment, and resource requests;
- queue, cluster, node, and accelerator placement;
- training and evaluation metrics;
- model, prompt, retrieval, tool, and response context for generative AI;
- lineage from an input through a deployed model or agent outcome.
No single signal answers every question. A GPU activity metric can show idle periods but not whether the input pipeline, distributed synchronization, or queue policy caused them.
Monitor user outcomes before components
Begin with service objectives and workload outcomes. For an inference service, measure availability, latency, errors, saturation, and output-quality guardrails. For training, measure submission-to-start delay, completion rate, duration, retries, useful throughput, and accepted model outcomes.
Then monitor the dependencies that explain those results: API services, queues, schedulers, Kubernetes objects, nodes, storage, networks, devices, and telemetry pipelines.
Avoid dashboards built only from whatever exporters happen to expose. A large collection of component charts can still fail to answer whether users can complete useful work.
Design actionable alerts
An alert should represent a condition that needs timely human or automated action. Give it an owner, severity, threshold rationale, evaluation window, routing labels, and runbook.
Prefer symptoms close to the user over low-level causes. Page for a sustained inability to run or serve workloads; create a lower-severity notification for early capacity pressure. Group related symptoms so one failing node does not send hundreds of Pod alerts.
Test alert delivery and absence detection. A silent telemetry pipeline must not look like a healthy system.
Preserve correlation without uncontrolled cardinality
Rich identifiers make debugging possible, but placing every run ID, user, prompt, or artifact digest into metric labels can make the metrics system expensive and unstable.
Use bounded dimensions for aggregation: service, environment, workload class, queue, cluster, model family, and outcome. Put unique identifiers into traces, logs, or Polyaxon run metadata, then link from a dashboard or alert to the detailed record.
Define retention and access by data type. Prompts, datasets, logs, traces, and evaluation examples can contain source code, credentials, personal data, or customer content. Redaction and authorization belong at collection and query boundaries.
Cover the telemetry system itself
Observability infrastructure is a distributed system. Monitor collectors, agents, scrape targets, dropped data, queues, export failures, sampling, ingestion limits, query latency, storage, and cost.
Record configuration changes and version upgrades. When a chart changes after a collector deployment, you need to distinguish a real workload shift from a changed metric name, label, aggregation, or sampling rule.
Connect platform and AI observability
Polyaxon platform observability covers the services that submit, schedule, track, and manage workloads. Run tracking connects application evidence to projects, inputs, parameters, logs, metrics, and artifacts.
Our guide to AI observability extends the model to generative AI behavior, where evaluation, retrieval context, tool calls, safety, cost, and feedback matter alongside infrastructure signals.
Build monitoring from known objectives and build observability for investigation. Together, they should let a team detect a harmful condition, narrow it to the responsible layer, recover safely, and learn enough to prevent the same class of failure.