What is AI observability?
AI observability connects traces, metrics, evaluations, feedback, and runtime context so teams can understand and improve models, applications, and agents.
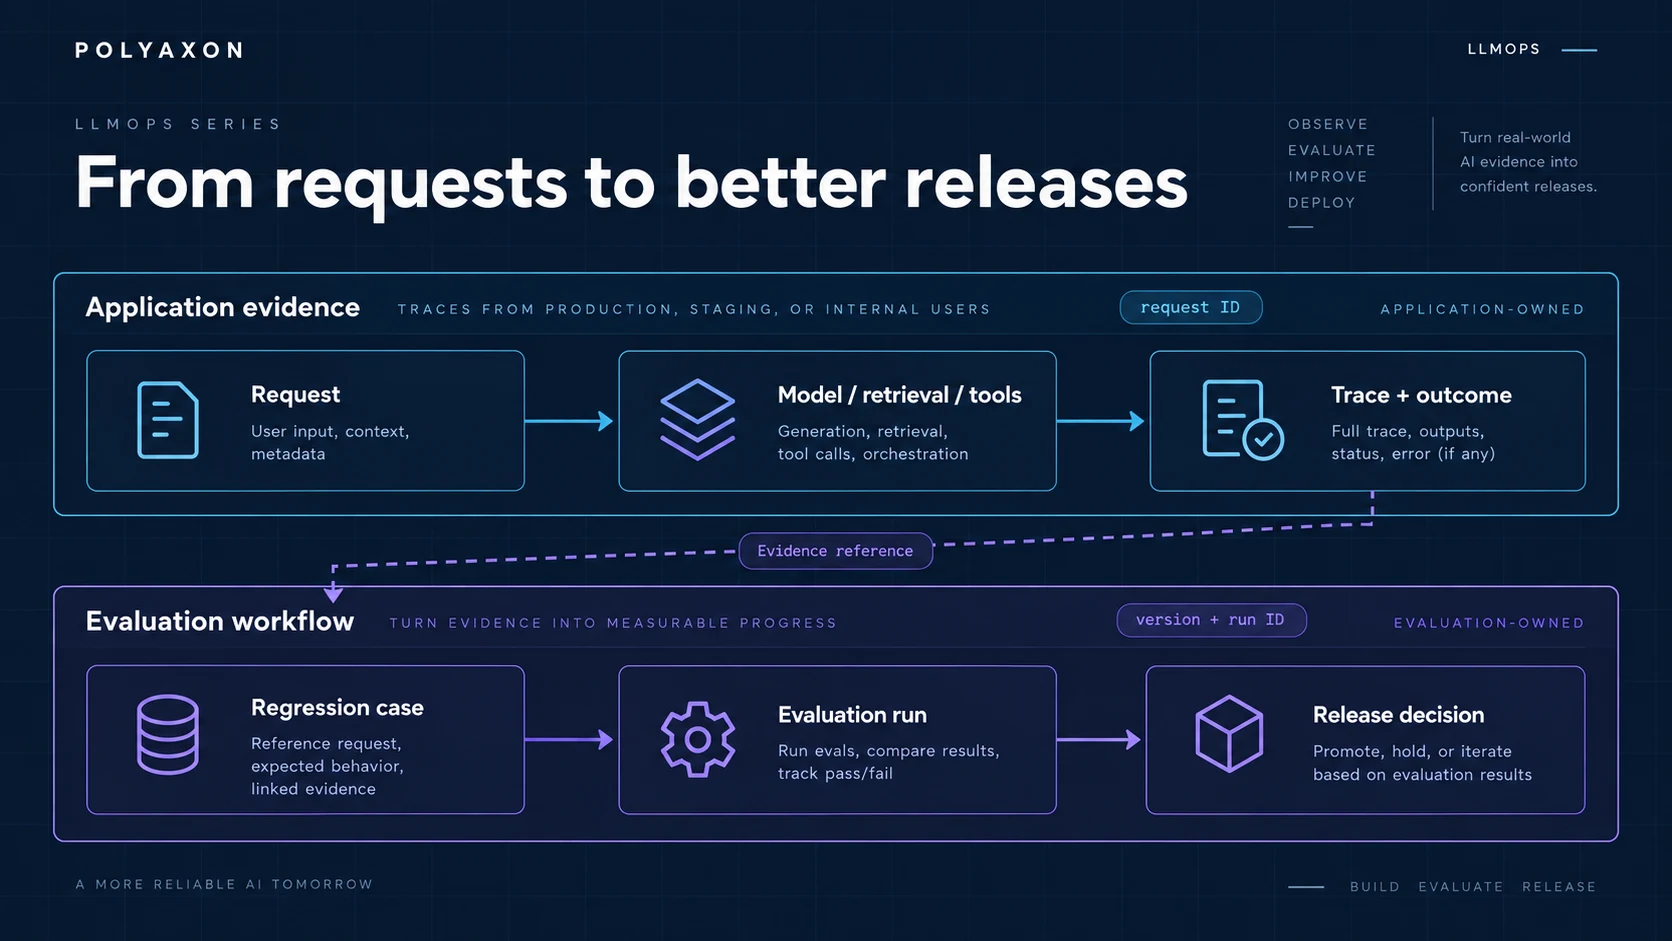
An AI system can be available, return a successful response, and still fail its user. A prediction can be inaccurate, a retrieval pipeline can surface stale context, or an agent can call the wrong tool while every infrastructure dashboard remains green.
AI observability is the practice of collecting and connecting the evidence needed to understand that behavior. It combines operational telemetry with AI-specific context—data and model versions, prompts, retrieved documents, tool calls, evaluations, user feedback, cost, and safety signals—so teams can explain what happened and improve what happens next.
The scope is broader than observability for machine learning. It covers predictive models, generative AI applications, retrieval-augmented generation (RAG), and multi-step agents, along with the infrastructure and workflows that support them.
What AI observability should answer
Monitoring starts with known conditions: Is the service up? Did latency cross a threshold? Are GPUs saturated? Observability goes further by helping teams investigate behavior they did not anticipate.
For an AI system, that means being able to answer questions such as:
- Which model, prompt, dataset, code version, and parameters produced this output?
- What context did the retrieval layer return, and was it relevant and current?
- Which tools did the agent call, in what order, and with what results?
- Did the output meet the application's quality, safety, and policy requirements?
- Why did task success fall after a model, prompt, or data change?
- Which steps add the most latency or cost without improving the outcome?
AI monitoring and AI observability are therefore related, but not interchangeable.
| AI monitoring | AI observability |
|---|---|
| Tracks predefined metrics and thresholds | Correlates signals to investigate known and unknown issues |
| Detects that latency, errors, drift, or cost changed | Explains which model, data, prompt, retrieval, tool, or infrastructure change contributed |
| Aggregates system health over time | Preserves request- and run-level context for debugging |
| Alerts teams to a symptom | Supports root-cause analysis and improvement |
Monitoring is one outcome of a good observability practice. The objective is not to collect every possible event; it is to preserve enough connected context to move from a symptom to a plausible cause and a testable fix.
Why traditional telemetry is not enough
AI systems inherit the failure modes of ordinary software and add new ones. They can still crash, time out, exhaust memory, or lose a network connection. They can also complete normally while producing an irrelevant, unsafe, biased, or factually incorrect result.
Several properties make these failures harder to diagnose:
- Outputs are statistical. The same request can produce different results, and quality often exists on a spectrum rather than as a pass-or-fail condition.
- Behavior depends on changing context. Training data, live inputs, retrieved documents, features, prompts, and user intent can shift independently of application code.
- A request crosses many components. An agent may route between models, retrieve context, call tools, update memory, retry steps, and apply guardrails before returning a response.
- Models can be opaque dependencies. With a managed model provider, teams can observe the request and response but not the provider's internal execution.
- Changes are frequent and coupled. A model swap, prompt edit, index refresh, parameter change, or tool update can alter quality without causing a conventional error.
Traditional logs, metrics, and traces remain essential. AI observability enriches them with the model, data, evaluation, and outcome context required to interpret AI behavior.
The layers of an observable AI system
Useful observability follows a request or run across the complete system rather than stopping at the model API.
Data and input context
Record the data version, source, schema, feature values, input distribution, and validation results that matter to the task. For RAG applications, capture the search query, retrieved document identifiers, ranking or relevance scores, data freshness, and the exact context supplied to the model.
This layer helps separate a model failure from a data-quality or retrieval failure. A fluent but incorrect answer may originate in an outdated document, a missing feature, or an irrelevant chunk ranked above the correct one.
Model and inference context
Capture the model and provider, model version, prompt template and version, inference parameters, input and output tokens, latency, response, and error details. Predictive systems should also preserve prediction distributions, confidence, and the model lineage needed to reproduce a result.
This context supports comparisons across model or prompt versions and makes cost, quality, and performance tradeoffs visible.
Application and orchestration context
A single model call rarely explains an entire application. Trace routing decisions, retrieval steps, tool inputs and outputs, retries, fallbacks, guardrail events, memory access, and the final response as parts of one execution.
For agents, this is what reveals an unproductive loop, a bad tool selection, a failed handoff, or an intermediate result that sent the workflow down the wrong branch.
Runtime and infrastructure context
Keep the operational signals that software teams already depend on: request rate, error rate, latency, throughput, queue time, CPU, memory, GPU utilization, storage, and network behavior. Training and self-hosted inference also need workload status, resource requests, scheduling decisions, container logs, and exceptions.
AI-specific telemetry cannot replace infrastructure observability. A poor response and a slow response are different problems, but teams often need both kinds of evidence to discover which one they have.
Evaluation and outcome context
Finally, connect the execution to a judgment. Depending on the use case, that can include accuracy, groundedness, relevance, task completion, policy compliance, user feedback, escalation rate, conversion, or another business outcome.
An evaluator can be a deterministic rule, a reference-based metric, a custom model, an LLM judge, or a human reviewer. High-risk decisions often need multiple methods and periodic human calibration rather than a single automated score.
The core signals of AI observability
The familiar observability signals still provide the foundation, but their content and use change for AI workloads.
Logs
Structured logs record discrete events: a model request, data validation failure, retrieval result, tool invocation, guardrail decision, or user feedback event. Stable trace, session, run, and step identifiers make those records queryable as one workflow instead of a collection of disconnected transcripts.
Metrics
Metrics show frequency and change over time. A useful set normally spans several categories:
- Reliability: availability, errors, timeouts, retries, and fallback rate.
- Performance: end-to-end latency, time to first token, throughput, queue time, and resource utilization.
- Quality: task success, accuracy, relevance, groundedness, drift, and evaluation scores.
- Cost: tokens, accelerator time, cost per request, and cost per successful outcome.
- Safety: policy violations, sensitive-data exposure, prompt-injection signals, and guardrail activation.
- Product outcomes: user feedback, abandonment, escalation, retention, or a use-case-specific business result.
Aggregate metrics reveal a trend. They become much more useful when a team can move from a changed metric to the individual runs or traces behind it.
Traces
A trace reconstructs the path of one request or agent run. Its spans can represent routing, retrieval, model calls, tool execution, guardrails, and application logic. Each span carries timing, inputs, outputs, errors, and version metadata appropriate to that step.
This makes a question such as “Why did the agent do that?” concrete. The team can inspect the sequence that actually ran instead of trying to reproduce a non-deterministic failure from a screenshot.
Evaluations and feedback
Logs, metrics, and traces show what happened. Evaluations and feedback help determine whether it was good.
Attach evaluation results to the trace or run they assess. This makes it possible to filter for failed cases, compare versions, discover recurring failure patterns, and turn production examples into regression datasets. The result is a closed loop: observe production behavior, curate representative cases, test a change, deploy it, and observe again.
An end-to-end example
Consider a support agent that answers a billing question and can issue a refund. The API returns 200, latency is within its target, and the model provider reports no error. The answer is nevertheless wrong, and the agent attempts an invalid tool call.
An end-to-end trace might show that:
- The retrieval step searched with an ambiguous product name.
- An outdated policy document received the highest relevance score.
- The model produced a confident answer from that context.
- The agent selected the refund tool with an unsupported reason code.
- A guardrail blocked the action and triggered a human handoff.
- The user marked the response as unhelpful.
Infrastructure monitoring can confirm that every component remained available. AI observability identifies the retrieval result and tool contract as the places to improve. The trace can then become a test case for a new search query, document index, prompt, and tool schema.
Preserve the connections between these records. For this example, an application-owned evidence record could look like this:
{
  "case_id": "billing-refund-042",
  "source_trace_id": "trace-reference-from-the-application",
  "application_revision": "support-assistant-v12",
  "corpus_revision": "billing-policies-v7",
  "retrieved_document_ids": ["refund-policy-retired"],
  "observed_failure": "outdated_evidence_and_invalid_tool_argument",
  "expected_behavior": "use_current_policy_or_escalate",
  "evaluator_revision": "refund-policy-rubric-v3"
}
The values are illustrative, and this is a record format for your workflow rather than a Polyaxon API schema. Retain the sanitized source passages and tool result in the governed evidence store. An evaluation run can then reference the same case and versions, record its result, and show whether a proposed change fixes the failure. A trace identifier provides a link; it does not copy the trace or guarantee that its source will retain it.
What teams gain from AI observability
A connected observability practice supports more than incident response:
- Faster debugging: follow a failed prediction or request across data, application, model, and infrastructure layers.
- Safer iteration: compare prompts, models, datasets, and workflows against representative evaluation cases before and after release.
- Earlier regression detection: find gradual changes in quality, drift, user behavior, or retrieval performance before they become widespread.
- Cost control: attribute spend to models, features, tenants, and individual workflow steps, then optimize it alongside quality.
- Security and governance: surface risky inputs and outputs, preserve decision context, and support review with access controls and retention policies.
- Shared operational language: give ML engineers, application developers, platform teams, product owners, and reviewers the same evidence.
How to implement AI observability
Start with one important workflow and a small number of questions. Instrumentation without a decision or debugging use case quickly becomes expensive data collection.
1. Define success and failure
Write down the operational, quality, safety, cost, and product outcomes that matter. A support agent might track task completion, groundedness, correct escalation, latency, and cost per resolved case. A fraud model might track precision, recall, feature drift, review rate, and inference latency.
2. Map the complete execution
Identify the boundaries between the user, application, data or retrieval layer, models, tools, guardrails, and infrastructure. Give each request or run a stable identifier and create spans for the steps that can change the outcome.
3. Capture versioned context
Record code, model, data, prompt, component, and environment versions. Include parameters and relevant metadata, but avoid collecting payloads simply because they are available. Redact secrets and personal data, restrict access, and set retention policies before sending production traffic.
4. Add evaluations gradually
Begin with a few checks that teams understand and trust. Combine deterministic rules with sampled human review, task-specific metrics, or model-based evaluation where appropriate. Calibrate automated evaluators against human judgments and monitor the evaluators themselves for change.
5. Connect aggregates to examples
Dashboards and alerts should lead back to the traces, runs, and evaluations that explain a change. Segment results by model version, prompt, dataset, workflow, user cohort, or another meaningful dimension so global averages do not hide a failing slice.
6. Turn failures into tests
Curate useful production failures and edge cases into evaluation datasets. Test proposed changes on those cases, compare the result with a baseline, and keep observing after deployment. This feedback loop is where observability starts improving the system rather than merely describing it.
Common mistakes to avoid
- Logging only prompts and responses. This misses retrieval, tool use, routing, versioning, and the user outcome that shaped the response.
- Tracking quality without operational context. A low score may be caused by an incomplete input, a timeout, stale data, or a fallback model.
- Collecting data without a retention plan. AI payloads can contain personal, confidential, or regulated information.
- Relying on one universal evaluation score. Quality is use-case-specific, and automated judges can be inconsistent or biased.
- Watching averages only. A system can look healthy overall while failing for one language, customer segment, model version, or task type.
- Separating production traces from evaluation. If failures cannot become tests, teams lose the evidence needed to prevent regressions.
AI observability with Polyaxon
Polyaxon connects observability across model development, AI applications, and the platform that runs them.
For machine learning workloads, the tracking API records parameters, metrics, code versions, artifacts, logs, resources, exceptions, lineage, and run history. Teams can compare experiments and preserve the context needed to reproduce training and evaluation results.
For LLM applications and agents, connect application telemetry to the experiment record: retain trace identifiers, application and evaluator revisions, measured metrics, and sanitized reports with metadata logging and artifacts. The application or its tracing integration must emit retrieval, model-call, and tool events; run resource monitoring does not infer those events from a successful job.
Keep instrumentation, evaluation logic, and execution ownership explicit. Your evaluator produces the judgments; Polyaxon can schedule that evaluation as an operation and retain its outputs for run comparison. For integrated LLM tracing and evaluation interfaces, consult the documentation and release status for your deployment; the roadmap describes the broader direction.
Polyaxon also separates application behavior from the health of the deployment itself. Platform observability covers the gateway, scheduler, workers, agents, logs, health checks, infrastructure metrics, and error-tracking integrations.
Within a workload, the run resources dashboard provides statuses, conditions, and resource measurements. Use it alongside the application evidence to distinguish a retrieval-policy failure from a memory limit, delayed scheduling, or another execution problem.
That shared context matters because AI failures rarely respect team or tool boundaries. The fastest path from a bad outcome to a reliable fix is a connected record of the data, model, application, evaluation, and infrastructure that produced it.