How to use the NGINX Prometheus exporter
Connect NGINX metrics to Prometheus with the NGINX Prometheus exporter and configure scraping for basic service monitoring.
Prometheus can only scrape what is exposed in a format it understands. Exporters bridge that gap for systems that expose useful signals in another shape. The NGINX Prometheus exporter turns NGINX status data into Prometheus metrics.
This is a small example, but the pattern matters: expose service health, scrape it consistently, and connect it to workload ownership before a degraded service becomes a mystery.
What is the NGINX Prometheus exporter?
NGINX is one of the most popular web servers used today, and the NGINX Prometheus exporter is a tool you can use to export metrics from your NGINX server and capture them in your Prometheus instance. While NGINX exposes a basic set of metrics via its stub status module, those metrics are not in a form that Prometheus can scrape. This is where prometheus-nginx-exporter helps. It listens to the stub_status endpoint and generates a feed of Prometheus-friendly metrics on an endpoint. You can then configure your Prometheus instance to scrape data from this endpoint and use it to track and analyze the performance of your NGINX server.
How to use the NGINX Prometheus exporter
To set up NGINX monitoring using Prometheus, you'll need the following:
- An NGINX server
- A Prometheus instance
- The prometheus-nginx-exporter
The walkthrough assumes NGINX runs in a Docker container named nginx, with the stub status module available, and Prometheus runs directly on that Docker host. If your topology differs, substitute addresses reachable from each process; localhost inside an exporter container refers to that container.
Add this server block inside NGINX's http configuration, or in a file included from that context such as /etc/nginx/conf.d/status.conf. It gives the status endpoint an explicit listener on port 8080:
server {
    listen 8080;
    location = /stub_status {
        stub_status;
    }
}
Validate and reload the NGINX configuration using your deployment's normal procedure. Keep this listener on a private network and do not publish port 8080 to the internet. The NGINX stub status module exposes connection and request counters, rather than Prometheus-formatted metrics.
From a client on that private network, request http://nginx:8080/stub_status. You should see output in this format; these counts are illustrative:
Active connections: 1
server accepts handled requests
 7 7 14
Reading: 0 Writing: 1 Waiting: 0
Give the existing NGINX container and the exporter a shared private Docker network. The network's DNS makes the container name nginx reachable from the exporter:
docker network create --internal nginx-monitoring
docker network connect nginx-monitoring nginx
docker run --detach --name nginx-exporter \
  --network nginx-monitoring \
  --publish 127.0.0.1:9113:9113 \
  nginx/nginx-prometheus-exporter:1.5.1 \
  --nginx.scrape-uri=http://nginx:8080/stub_status
The example pins the exporter to 1.5.1, a version documented in the upstream exporter guide. Review release compatibility and your image policy when selecting a version for your deployment.
The data path is now NGINX :8080/stub_status → exporter :9113/metrics → Prometheus. On the Docker host, request the exporter endpoint:
curl --fail http://127.0.0.1:9113/metricsYou should find metric families like the following. Counter values depend on your traffic; build information and additional metrics vary by exporter version.
# HELP nginx_connections_accepted Accepted client connections
# TYPE nginx_connections_accepted counter
nginx_connections_accepted 10
# HELP nginx_connections_active Active client connections
# TYPE nginx_connections_active gauge
nginx_connections_active 1
# HELP nginx_connections_handled Handled client connections
# TYPE nginx_connections_handled counter
nginx_connections_handled 10
# HELP nginx_connections_reading Connections where NGINX is reading the request header
# TYPE nginx_connections_reading gauge
nginx_connections_reading 0
# HELP nginx_connections_waiting Idle client connections
# TYPE nginx_connections_waiting gauge
nginx_connections_waiting 0
# HELP nginx_connections_writing Connections where NGINX is writing the response back to the client
# TYPE nginx_connections_writing gauge
nginx_connections_writing 1
# HELP nginx_http_requests_total Total http requests
# TYPE nginx_http_requests_total counter
nginx_http_requests_total 21
# HELP nginx_up Status of the last metric scrape
# TYPE nginx_up gauge
nginx_up 1
Merge this job into the existing scrape_configs list in Prometheus's configuration and reload Prometheus:
scrape_configs:
  - job_name: nginx-exporter
    scrape_interval: 5s
    static_configs:
      - targets: ['127.0.0.1:9113']
If Prometheus also runs in a container, join it to the private network and use nginx-exporter:9113 as the target instead. The host loopback target above is only correct for Prometheus running directly on the host. For a remote Prometheus server, use a private reachable address with appropriate access controls.
Check both up{job="nginx-exporter"} and nginx_up{job="nginx-exporter"}. The first reports whether Prometheus can scrape the exporter; the second reports whether the exporter can scrape NGINX. A successful exporter scrape with nginx_up equal to zero points toward the NGINX URI, network path, or status configuration.
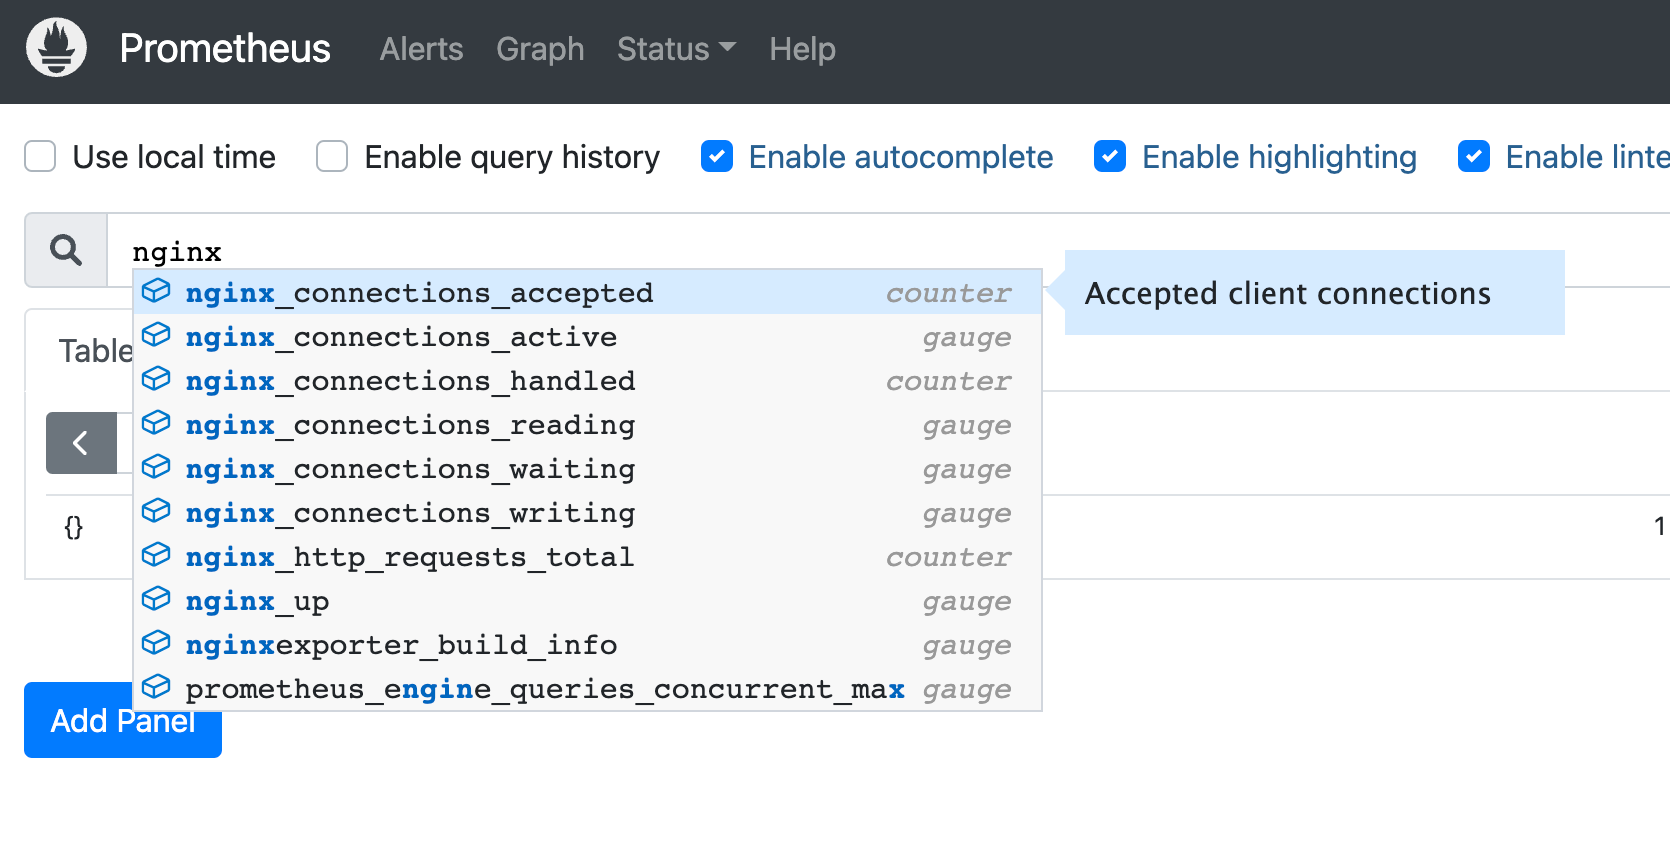
Once both are 1 and samples have arrived, NGINX-related metrics appear in PromQL suggestions. This illustration shows the metric discovery workflow; the UI may differ by Prometheus version:
For example, query requests per second and active connections:
rate(nginx_http_requests_total{job="nginx-exporter"}[5m])nginx_connections_active{job="nginx-exporter"}Stub status does not provide per-route latency or HTTP response-code breakdowns. Instrument the application or another appropriate telemetry source for those questions. See Kubernetes monitoring for ML workloads for connecting service health with workload progress.
To remove just the monitoring resources from this walkthrough, first remove its Prometheus scrape job, then run:
docker rm --force nginx-exporter
docker network disconnect nginx-monitoring nginx
docker network rm nginx-monitoring
Remove the added status server block and reload NGINX if it is no longer needed. The existing application container remains in place.
Final thoughts
The NGINX exporter is a straightforward example of a broader monitoring pattern: expose service metrics, scrape them consistently, and make the labels clear enough to debug later.
For Polyaxon deployments, this same thinking applies to platform services and user workloads. Metrics are more useful when they can be connected to projects, runs, queues, and owners.