Diagnose waiting workloads with agent and queue history
Use Polyaxon queue and agent statistics with run timelines to distinguish policy limits, workload changes, and Kubernetes placement problems before adding capacity.
A team reports that its training runs are waiting longer. Before raising concurrency or adding GPUs, compare the affected queue with the agent that runs it. The queue may be enforcing an intentional limit, another queue may be consuming shared capacity, or the run may already have reached Kubernetes and be waiting for placement.
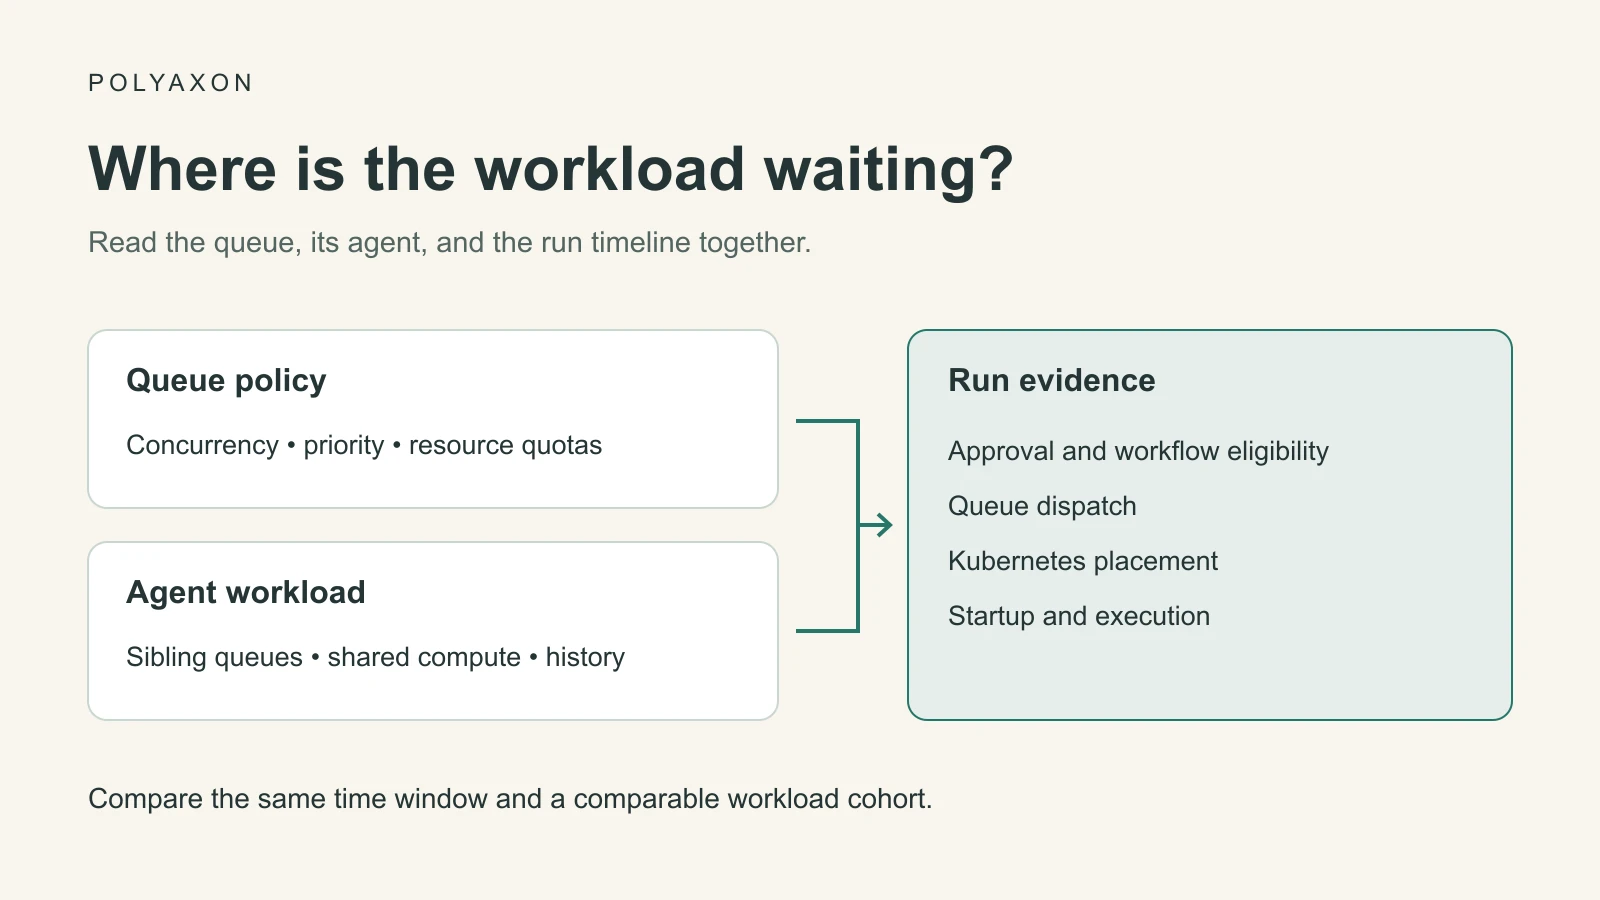
Polyaxon's queue and agent history helps turn that complaint into a scoped investigation. Start with the current state, compare a relevant historical interval, and use individual run timelines to explain where the delay occurs.
Polyaxon v2.10 introduced agent and queue statistics and overview trends; historical tracking for these resources is listed under the commercial offering. This article uses those capabilities as an investigation workflow. The older queue saturation post explains the saturation display, while the queue guide covers routing and policy.
Begin with one concrete waiting run
Identify a run UUID, project, assigned queue, and compute agent. Open its status history and read the conditions attached to the transition where progress stopped. Establish whether the workload is awaiting approval, constrained by its parent workflow, waiting on queue policy, or already facing a Kubernetes scheduling or startup problem.
Do not use “Pending” as a universal diagnosis across all these layers. A Kubernetes Pod waiting for a suitable GPU is different from an operation that has not yet been dispatched. A notebook that keeps running while idle is different from a training task that has stopped making progress.
The queue documentation describes the status timeline and how the agent routes operations to a namespace or cluster. Keep the actual status timestamps and conditions in the investigation record; they are more useful than a screenshot of a single count.
Compare queue policy with current demand
Inspect the affected queue's configuration and current statistics. Record its concurrency, priority, resource quota where configured, and the workload mix using it. Also inspect the parent matrix or DAG's concurrency: a queue cannot dispatch a child that the workflow has not made eligible.
A queue saturation indicator describes the configured queue constraint. It is not a measurement of GPU kernel utilization or proof that every node is busy. Queue concurrency counts operations under the scheduler's rules; different operations can request very different amounts of CPU, memory, or GPUs.
For example, a queue limited to two concurrent operations can reach its limit with two lightweight runs while other cluster resources remain available. Raising that limit might help if the remaining capacity is suitable and the policy permits it. The same adjustment could overload a cluster if those two runs are distributed jobs using many workers.
Look across queues on the same agent
Open the agent associated with the queue and inspect its workload and history over the same interval. Compare sibling queues because they can share the agent's namespace or cluster. A queue with few active runs may still compete with a busier sibling.
Keep placement constraints in view. An agent-wide CPU or GPU total cannot establish that a particular request fits. The workload may require a specific device type, node label, topology, volume, or several workers at once. Use Kubernetes events and replica status to determine which requirement prevents placement.
This distinction helps avoid a common mistake: moving a run to another queue on the same constrained agent and expecting new physical capacity. A different queue changes policy or routing only according to its configuration. Confirm the destination agent, namespace, accessible resources, and project permissions before treating that move as a capacity change.
Interpret history using comparable windows
Compare the incident window with a useful baseline, such as the same team's previous scheduled batch. Record the exact interval and timezone. Check whether the population includes interactive services, retries, distributed runs, or only the batch jobs being investigated.
Historical charts may aggregate or retain data at different resolutions. Check the available interval and aggregation before interpreting a short spike or comparing it with a long-range trend. A missing point is not evidence of zero activity.
These illustrative patterns guide the next check; they are not measured Polyaxon results:
| Pattern | What to inspect next |
|---|---|
| Queue stays at its configured limit while more work becomes eligible | Queue concurrency, quotas, and the intended sharing policy |
| A queue slows down as sibling workloads increase | Shared agent capacity and relative queue policy |
| Active run count looks similar, but completion takes longer | Changes in workload size, distributed shape, input loading, and runtime |
| Work is dispatched, but replicas wait for placement | Node/device availability, taints, affinity, volumes, and Kubernetes quotas |
| Delays begin before children enter the queue | Parent dependencies, approval, and workflow concurrency |
Run counts, durations, requested resources, and actual resource utilization answer different questions. Use the available Polyaxon history to identify where to investigate, then corroborate with run logs, events, and resource telemetry appropriate to the workload.
Change one constraint and retain the evidence
Choose the change that matches the observed bottleneck. Examples include adjusting a queue's concurrency, moving long-lived notebooks to a deliberately scoped queue, correcting an oversized request, or adding capacity of the device type that is actually missing.
Use the queue management workflow for authorized policy changes. Keep the previous configuration, the change time, and the reason in your operational record. Raising a queue limit changes how work can compete; it does not guarantee faster completion.
After the change, compare a similar workload cohort. Track where time was spent, whether completion improved, and whether another team or queue experienced a regression. Avoid claiming success from one run that happened to arrive during a quiet interval.
A compact review record should contain the affected run IDs, queue and agent identities, baseline and incident windows, relevant configuration, observed blocking conditions, and the post-change comparison. Store that evidence with an operational review or a Polyaxon tracking run when the investigation is part of an automated workflow.
The useful outcome is a supported explanation: which layer delayed the workload, which constraint changed, and what happened afterward. Queue and agent history provides the broader context; the run timeline ties it back to the user's actual wait.