Monitor Kubernetes ML workloads with Prometheus
Build a useful Prometheus monitoring model across Kubernetes objects, nodes, containers, applications, and ML operations without uncontrolled cardinality.
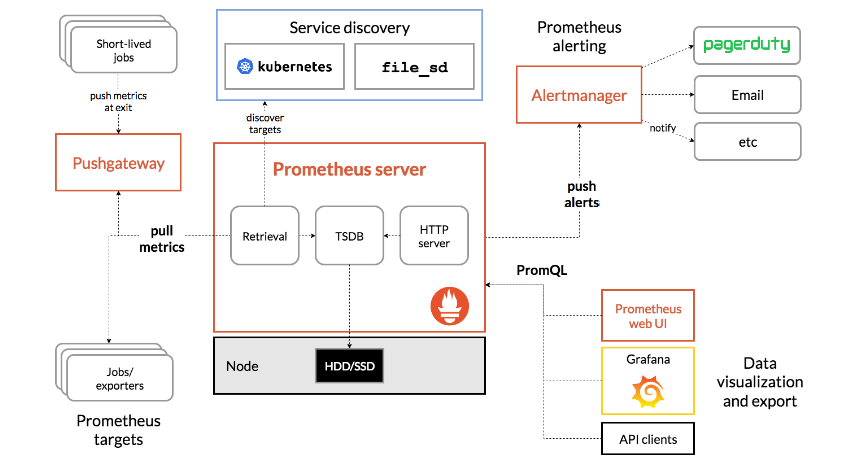
Prometheus is well suited to Kubernetes because both systems assume that targets and workloads change continuously. Prometheus discovers targets, scrapes numeric time series, evaluates PromQL rules, and sends firing alerts to Alertmanager.
A reliable deployment still needs a measurement model. Scraping every endpoint does not tell a platform team which capacity is unavailable, which workload is failing, or whether an ML operation is making useful progress.
Monitor several layers together
Separate the cluster into measurement layers:
| Layer | Useful questions |
|---|---|
| Control plane | Is the API responsive? Are controllers and the scheduler healthy? |
| Kubernetes objects | Do desired and available replicas differ? Are Pods pending, restarting, or evicted? |
| Nodes and containers | Is CPU, memory, disk, network, or PID pressure developing? |
| Applications | Are requests succeeding within latency targets? |
| ML operations | Is a run queued, active, progressing, retrying, or complete? |
No single percentage represents all five layers. A GPU can be allocated but idle, a container can use CPU while waiting for data, and a healthy Pod can host an application that produces incorrect results.
The Prometheus overview describes its pull model and time-series data model. Kubernetes object-state exporters and node/container collectors complement application instrumentation; they should not be treated as interchangeable sources.
Discover targets with clear ownership
Prometheus supports Kubernetes service discovery for Pods, Services, EndpointSlices, Nodes, and other roles. Relabeling decides which discovered objects become scrape targets and which metadata becomes labels.
Keep discovery rules narrow. An “annotate anything to make Prometheus scrape it” convention can expose sensitive endpoints, duplicate targets, or ingest unbounded metrics. Prefer platform-owned monitors or explicitly reviewed annotations with namespace and network-policy boundaries.
Inspect the monitoring objects in their actual namespace:
kubectl get servicemonitors,podmonitors,prometheusrules \
  --context acme-production \
  --namespace monitoring

kubectl describe servicemonitor ml-services \
  --context acme-production \
  --namespace monitoring
The exact custom resources depend on the Prometheus distribution. Verify the generated targets in Prometheus rather than assuming discovery configuration produced one healthy scrape per endpoint.
Design labels before dashboards
Labels make PromQL expressive, but every unique label combination creates another time series. Avoid labels whose value grows without a firm bound: request IDs, timestamps, file paths, exception messages, user input, or arbitrary run parameters.
Useful bounded dimensions often include cluster, namespace, workload type, component, status, accelerator class, and team. A unique Polyaxon run ID belongs in logs, traces, exemplars, or operation metadata unless a specific metric and retention budget justify it.
Track cardinality and ingestion as first-class capacity signals. A seemingly small metric with project, run, Pod, image, dataset, node, and endpoint labels can multiply rapidly.
Query rates and ratios correctly
Counters increase over time and should normally be queried with rate() or increase(). Aggregate after calculating the rate so resets are detected per series:
sum by (namespace) (
  rate(container_cpu_usage_seconds_total{container!="", image!=""}[5m])
)
For a request error ratio, keep numerator and denominator aligned:
sum(rate(http_requests_total{status=~"5.."}[5m]))
/
sum(rate(http_requests_total[5m]))
Guard dashboards and alerts against missing denominators and low traffic. A ratio without request volume can turn one failure into an apparently catastrophic percentage.
For classic histograms, preserve the le label when calculating a percentile:
histogram_quantile(
  0.95,
  sum by (le, service) (rate(http_request_duration_seconds_bucket[5m]))
)
The official PromQL function reference documents the different expression required by native histograms.
Record expensive shared expressions
Dashboards and alerts often repeat the same joins and aggregations. Recording rules precompute those expressions into new time series. They reduce query latency and create a reviewed metric contract between platform teams and consumers.
Use a naming convention that states the aggregation and window. Keep source rules in version control, validate them before deployment, and monitor evaluation failures and missed rule iterations. The Prometheus recording-rule documentation explains rule groups and validation.
Recording rules do not repair poor source labels. Precomputing a high-cardinality query can reproduce the same cost under a different name.
Alert on impact and capacity
Page on symptoms that need timely human action: sustained serving failures, a critical training queue that cannot make progress, or monitoring that stopped observing the platform. Route diagnostic causes—one Pod restart, a short CPU spike, a transient scrape failure—to dashboards or lower-urgency workflows.
Use for windows, ownership labels, runbook links, and Alertmanager grouping. Test the full path from rule evaluation through notification delivery. A green Prometheus Pod is not proof that pages reach the correct team.
Connect metrics to Polyaxon
Polyaxon supplies the execution state that infrastructure metrics lack. Use it to separate queued time, start latency, active execution, retries, and completion. Compare those states with node, container, storage, network, and accelerator signals.
The result is a causal workflow: find the affected operation, inspect its compiled resources and scheduling context, correlate the time window in Prometheus, then use logs and events for detail. Monitoring becomes useful when it explains both whether Kubernetes is healthy and whether shared compute is producing valuable ML work.