PromQL cheat sheet for Kubernetes ML platforms
Use practical PromQL patterns for Kubernetes capacity, workload reliability, latency, and ML operations while controlling cardinality.
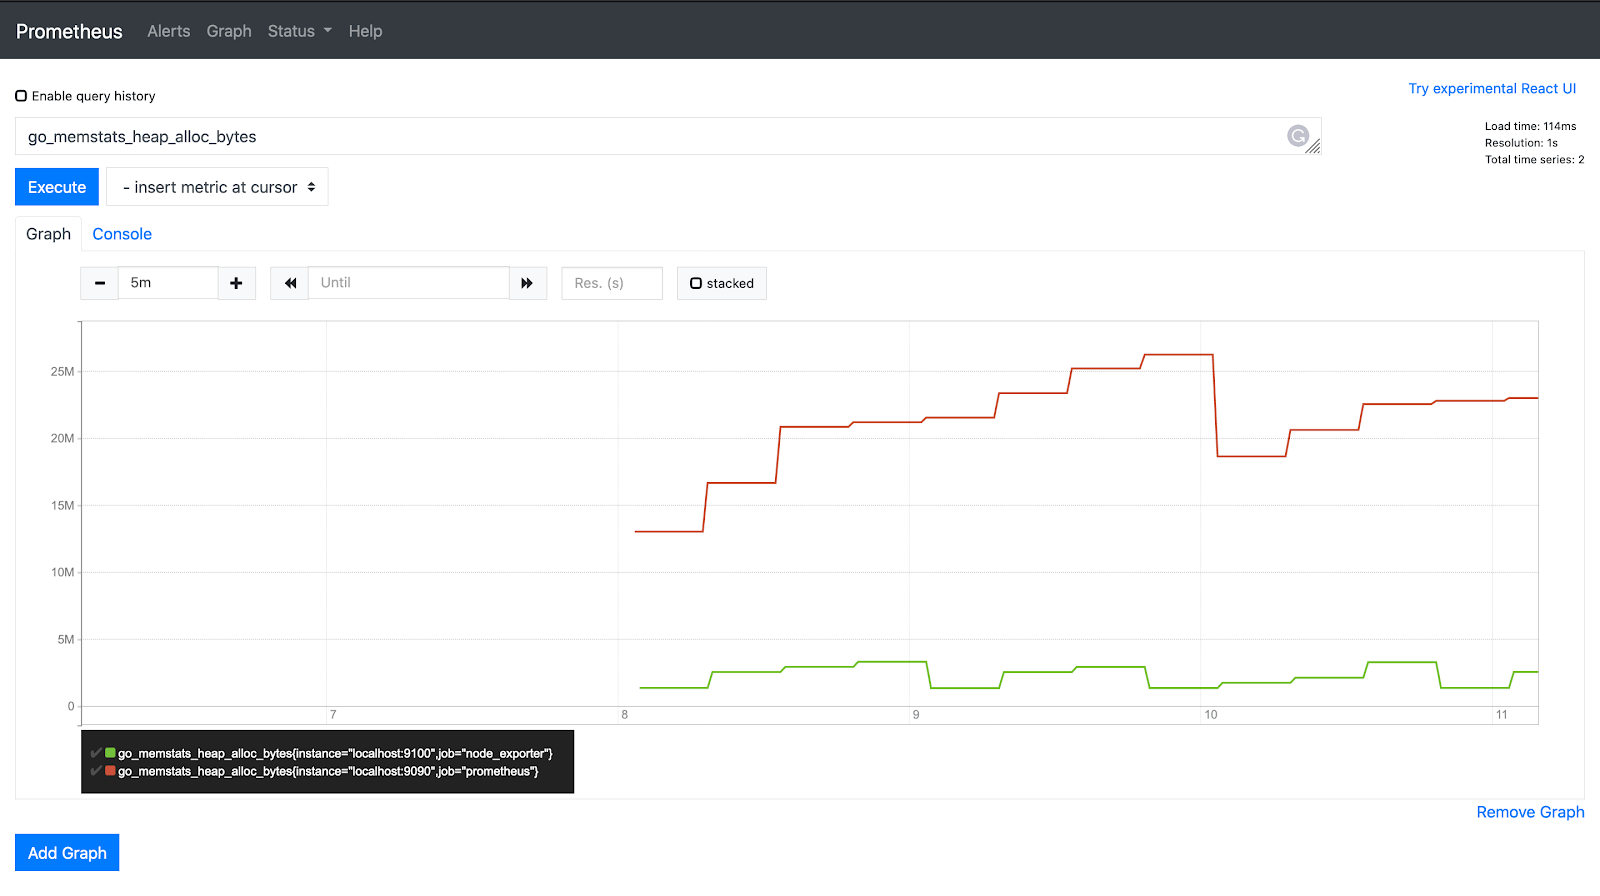
PromQL is most useful when a query begins with a precise operational question. Metric names and labels vary between Prometheus installations, exporters, and recording-rule packages, so treat the examples below as patterns to adapt—not a portable dashboard contract.
Confirm each metric's type, unit, labels, and scrape interval before alerting on it.
Select and inspect a metric
An instant-vector selector returns the latest sample for every matching series:
up{namespace="ml-team"}Matchers support exact, negative, regular-expression, and negative-regular-expression forms:
up{namespace=~"ml-.*", job!="debug-exporter"}Begin broadly enough to inspect the available label set, then narrow it. An empty result may mean the target is down, the selector is wrong, or the metric is absent. Those cases have different operational meanings.
Calculate rates before aggregating counters
Counters increase and reset when a process restarts. Use rate() for a per-second trend and increase() for the estimated change over a window:
sum by (namespace) (
  rate(container_cpu_usage_seconds_total{container!="", image!=""}[5m])
)
Apply rate() before sum() so Prometheus can detect resets for each input series. Use a range that contains several samples and matches the response time you care about. A one-minute range on a one-minute scrape interval is fragile.
Measure request success and latency
Calculate an error ratio with aligned dimensions:
sum by (service) (rate(http_requests_total{status=~"5.."}[5m]))
/
sum by (service) (rate(http_requests_total[5m]))
Pair the ratio with request volume. A single failed request during a quiet period should not produce the same response as a sustained production outage.
For a classic histogram, calculate the 95th percentile while retaining le:
histogram_quantile(
  0.95,
  sum by (service, le) (
    rate(http_request_duration_seconds_bucket[5m])
  )
)
Native histograms use a different expression. Check the current Prometheus histogram_quantile() documentation for the metric type you operate.
Compare container usage with requests
CPU usage divided by requested CPU shows how much of the declared scheduling baseline a workload uses:
sum by (namespace, pod) (
  rate(container_cpu_usage_seconds_total{container!="", image!=""}[5m])
)
/
sum by (namespace, pod) (
  kube_pod_container_resource_requests{resource="cpu", unit="core"}
)
A value above one is possible: a request is not a CPU ceiling. Missing or zero requests also need explicit handling. Use this view for right-sizing analysis, not as an automatic failure alert.
For memory, compare a consistently defined working-set or RSS metric with both request and limit. Document whether caches are included. Memory has different failure semantics from CPU: a limit can result in an OOM kill rather than throttling.
Find restarts and termination reasons
Detect recent restart growth:
sum by (namespace, pod, container) (
  increase(kube_pod_container_status_restarts_total{namespace="ml-team"}[15m])
)
Correlate that result with the last termination reason:
kube_pod_container_status_last_terminated_reason{
  namespace="ml-team",
  reason=~"OOMKilled|Error"
} == 1
The second metric is context, not proof that the termination occurred within the selected time window. Use Kubernetes events and logs to confirm sequence and cause.
Inspect Pending workload reasons
Object-state metrics can show Pods waiting for scheduling:
sum by (namespace) (
  kube_pod_status_phase{phase="Pending"} == 1
)
“Pending” includes several situations. Separate unschedulable placement, image pulls, initialization, and volume preparation with condition and container-state metrics where available. For ML platforms, combine this with operation queue state so intentional queueing is not mistaken for a Kubernetes failure.
Detect missing signals
absent() returns a value when no matching series exists:
absent(up{job="polyaxon-platform"})Use it carefully. A deployment name, relabeling rule, or namespace change can make a strict selector disappear even when the service is healthy. Test missing-signal alerts during planned rollouts and monitoring maintenance.
Join only when the data model requires it
PromQL vector matching can enrich a resource metric with workload metadata, but many-to-many relationships fail and careless joins multiply series. Reduce each side to the intended uniqueness first, specify matching labels, and use group_left or group_right only when the cardinality is understood.
Prefer recording rules for reviewed joins shared by dashboards and alerts. A recording rule creates a stable, cheaper interface but does not fix ambiguous labels.
Control cardinality
Every unique label combination is another time series. Avoid request IDs, file paths, exception messages, timestamps, free-form parameters, and unique experiment identifiers as general metric labels.
Keep cluster, namespace, workload class, team, status, and accelerator type only when each has a bounded operational purpose. Put unique Polyaxon run IDs in logs, traces, exemplars, or linked operation metadata.
Add ML operation context with Polyaxon
Infrastructure metrics can say that a Pod used memory or a GPU was active. Polyaxon can say whether the operation was queued, initializing, training, retrying, or complete and which component and parameters produced it.
Use PromQL for trends and fleet-level decisions, then move from a selected time window and bounded workload identity into Polyaxon for run-level context. A good query reduces the search space; it should not try to encode the entire experiment in metric labels.