Monitor Polyaxon services with Prometheus
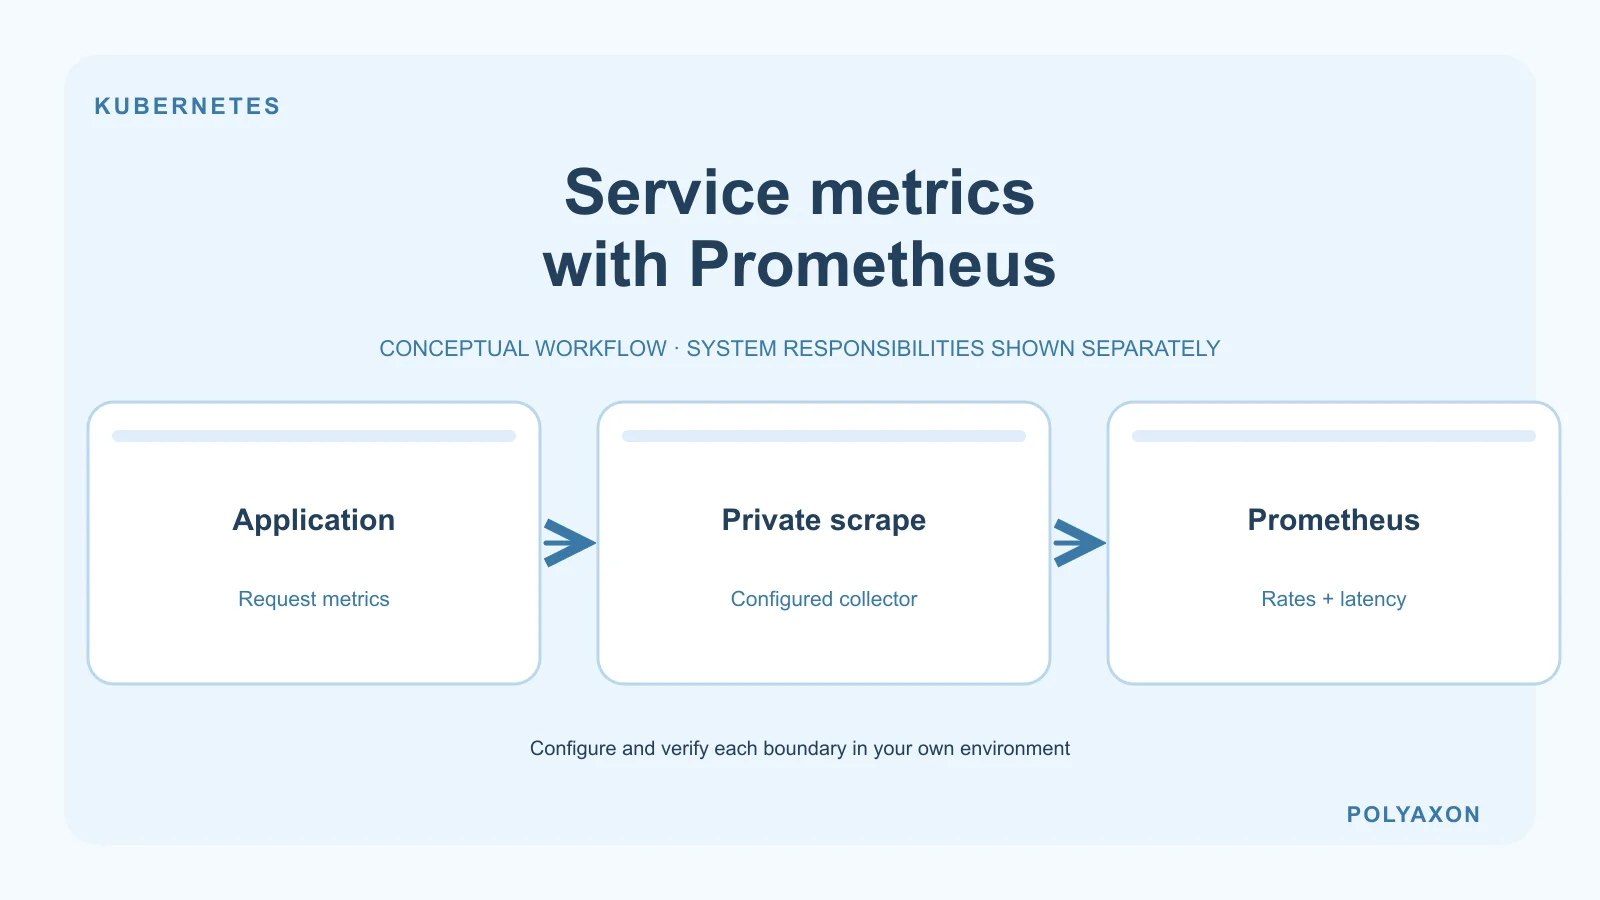
Instrument application request metrics in a Polyaxon service and configure a separate Prometheus collector to scrape them.
Use Prometheus to observe a long-running application deployed as a Polyaxon service. Instrument the application to expose operational metrics, then configure your Prometheus installation to collect them.
Polyaxon runs the service; your application or model server provides the metrics endpoint. This workflow does not automatically export Polyaxon experiment metrics to Prometheus.
Choose application metrics
Start with the questions you need to answer during an incident:
- Traffic: How many requests is the service receiving?
- Errors: How many requests fail, and which error categories are increasing?
- Latency: How long do requests take, including queueing and inference?
- Capacity: How many requests are in flight or waiting?
Use a Prometheus client library when instrumenting your own code, or follow your model server's documentation for its existing endpoint. Counters suit request and error totals, histograms suit request durations, and gauges suit queue depth or in-flight requests.
Expose and scrape the endpoint
- Add instrumentation to the application image. A health endpoint alone is not a metrics endpoint.
- Configure the application's metrics address, port, and path. Ensure the process listens on an interface reachable by your collector, not only on loopback.
- Deploy the application using your Polyaxon service configuration. See the FastAPI serving guide for the application deployment workflow.
- Configure the matching target in Prometheus, using your installation's Kubernetes discovery or monitoring-operator resources. Follow the scrape configuration reference.
- Confirm the target is healthy, make a request to the application, and check that the relevant request counter increases. Then inspect latency and errors in your dashboard.
Keep the metrics endpoint private. Give the collector the required network access and credentials; do not expose internal metrics publicly just to make scraping work. If the target is missing, inspect discovery selectors. If it is present but unhealthy, check the address, path, port, TLS, and authentication settings.
Keep labels bounded
Use a small, predictable set of labels, such as route templates and response categories. Do not use prompts, user IDs, request IDs, or arbitrary input values as metric labels: each unique label combination creates another time series. See the Prometheus label guidance.
Separate service health from experiment results
Use Prometheus for operational signals across service replicas. Use Polyaxon tracking for training metrics, evaluation results, parameters, and artifacts tied to individual runs. Short-lived training jobs may finish between scrapes, so a service-scraping setup is not a substitute for recording their results.
For pod, container, and node metrics around the service, continue with Prometheus cluster monitoring.