Investigate Polyaxon workload health with Prometheus
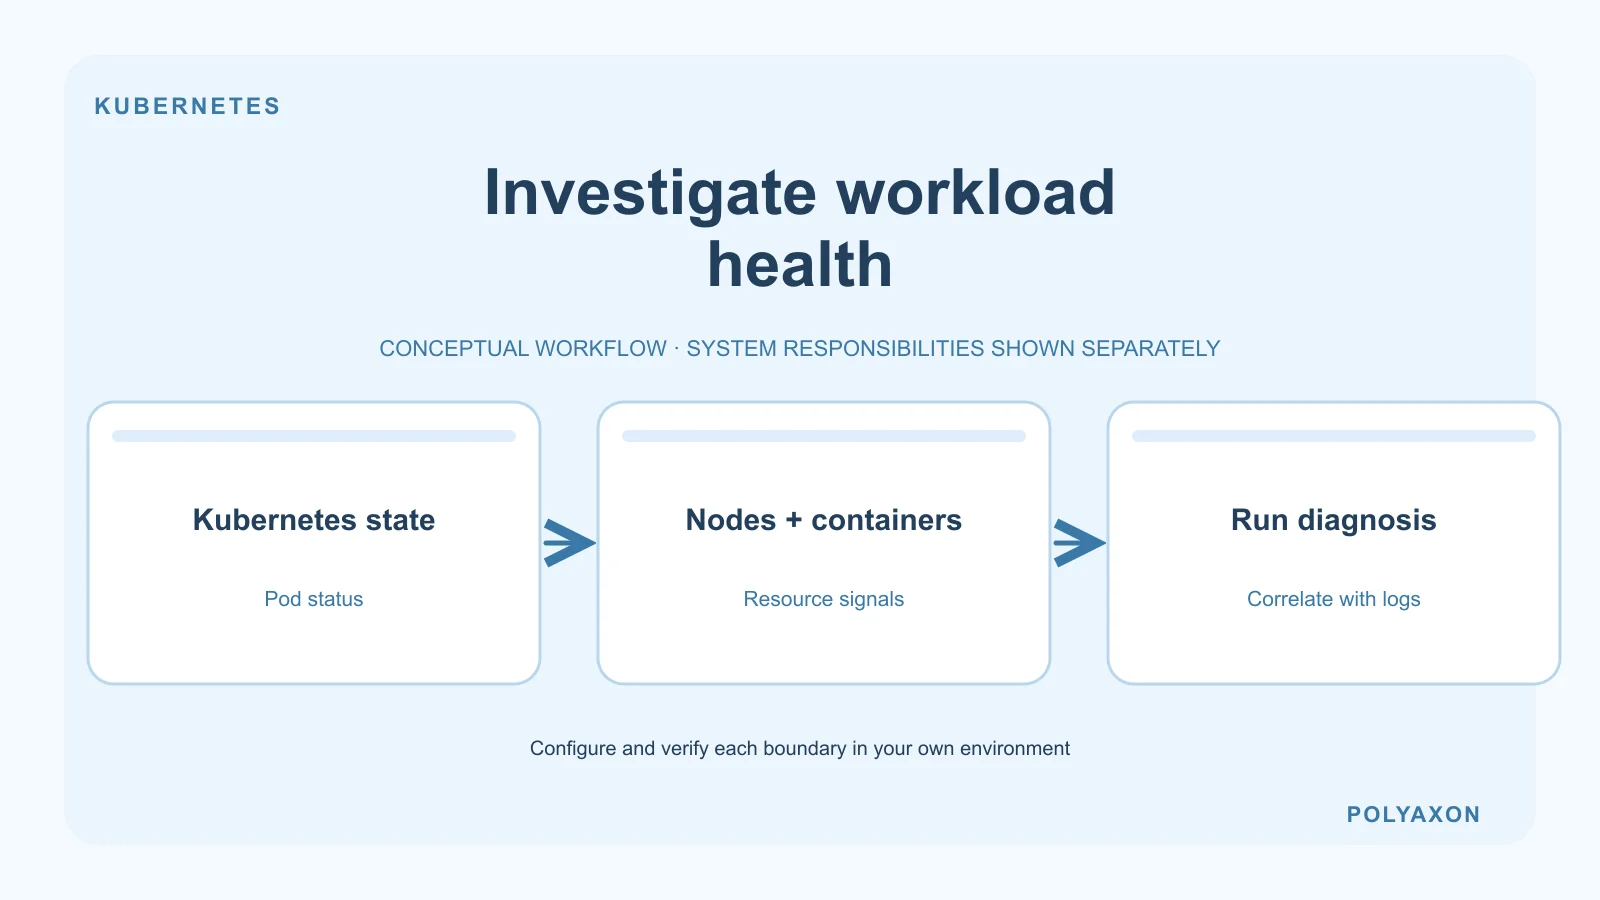
Correlate Kubernetes object state, container usage, and node health when investigating a Polyaxon workload.
Use Prometheus to monitor the Kubernetes infrastructure running Polyaxon and its workloads. Start with cluster, node, and container metrics to investigate pending jobs, pod restarts, and resource pressure.
This guide focuses on investigating a particular workload. For the broader monitoring model, see Kubernetes monitoring with Prometheus. For request rates, errors, and latency inside your own model-serving application, see Prometheus service monitoring.
Prerequisites
- A Kubernetes cluster running Polyaxon.
- A Prometheus installation or managed Prometheus service with access to the cluster's monitoring endpoints.
- Permission to configure metric collection and the required Kubernetes access controls.
Use your existing monitoring installation when possible. Installing a second collector without coordinating its targets can duplicate collection and increase operating costs.
Choose the metrics to collect
Different collectors answer different questions:
- Kubelet/container metrics: CPU and memory usage for running containers.
- kube-state-metrics: Kubernetes object state, such as pod phases and container restart counts. These describe Kubernetes objects rather than measuring live resource consumption.
- Node exporter: Host operating-system metrics, including CPU, memory, filesystem, and network activity.
Monitor both the Polyaxon platform namespace and the namespaces where agents launch workloads. A healthy platform does not guarantee that the nodes executing a training job have enough capacity.
Connect and verify collection
- Enable the relevant collectors through your cluster's monitoring stack. Follow its version-specific installation and permission requirements.
- Configure Prometheus discovery and scraping for those collectors using the Prometheus configuration reference.
- Check that the intended targets appear and are healthy in Prometheus. Investigate authentication, network policy, and discovery errors before building dashboards.
- Filter the collected metrics by the actual namespace, pod, and container labels in your deployment. Confirm that a known Polyaxon workload appears.
- Add dashboards and alerts for sustained resource pressure, unavailable workloads, and repeated restarts. Choose thresholds from your workload requirements rather than copying arbitrary defaults.
Collect from documented exporter endpoints; do not assume every Polyaxon component exposes a Prometheus /metrics endpoint. Keep monitoring endpoints on a restricted network and configure authentication where required.
Investigate a workload
When a run is slow or fails, correlate its pod's resource usage and restarts with node health. Then use the run's logs and experiment metrics to investigate the training behavior itself. Infrastructure metrics do not replace model-quality evaluation.
For platform probes and logs, continue with self-hosted observability. For a broader walkthrough, read Kubernetes monitoring with Prometheus.