GPU utilization metrics: allocation, activity, and throughput
Learn which GPU utilization metrics explain capacity, device activity, memory pressure, and useful ML throughput—and how to avoid misleading averages.
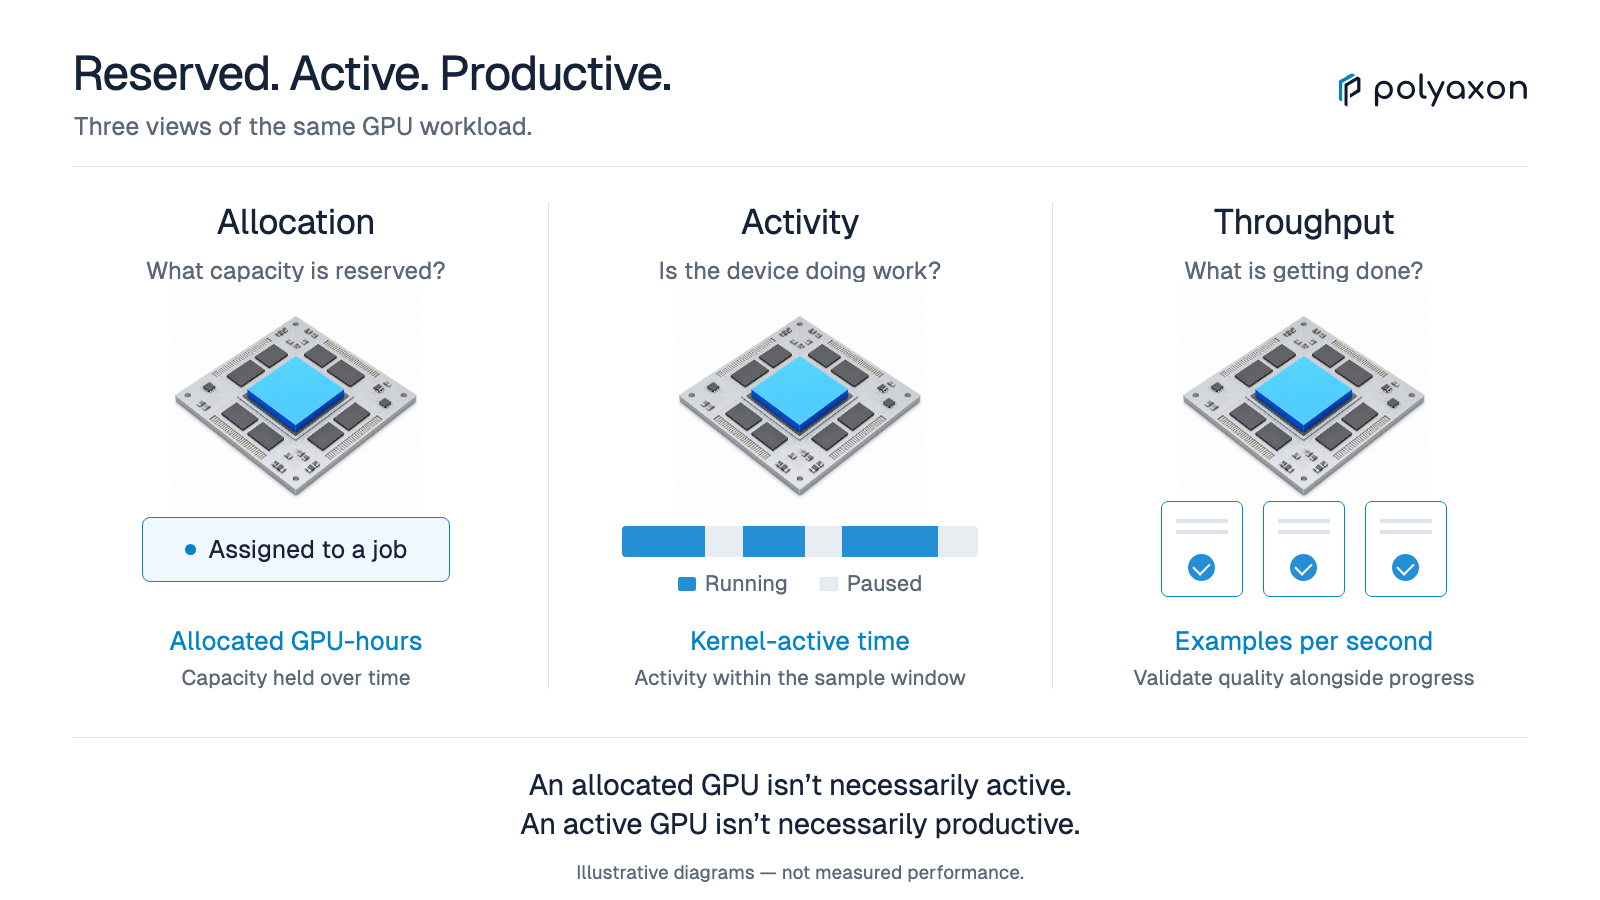
A cluster can have no unallocated GPUs and still produce very little useful work. Jobs may be waiting for data, distributed workers may be waiting for peers, or notebooks may be holding devices between experiments. Conversely, an inference service can have deliberately spare capacity to absorb traffic without missing its latency target.
That is why GPU usage matters—and why a single utilization percentage is not enough. Capacity planning, application tuning, and cost allocation need different measurements. Start by separating three questions: what is reserved, what is active, and what is getting done?
Separate allocation, activity, and throughput
Use these measurement layers together:
| Layer | Example measurement | Question it answers |
|---|---|---|
| Capacity allocation | Allocated GPU-hours divided by allocatable GPU-hours | How much eligible capacity is assigned? |
| Device activity | GPU activity over sampled intervals | Is the device running kernels? |
| Resource pressure | Memory occupancy, memory traffic, or compute-pipeline activity | Which part of the device needs closer investigation? |
| Application progress | Examples per second, tokens per second, or completed trials | Is the workload advancing? |
| Useful outcome | Time and resource-hours to a validated result | Is that progress valuable at the required quality? |
None is a substitute for the others. Allocation is useful for understanding access to capacity. Application progress explains whether a run is doing work. Outcome measures prevent a faster but invalid experiment from appearing to be an improvement.
Keep queue wait and startup time alongside runtime measurements. They affect when a result becomes available even though they may not appear in a GPU activity graph.
Read device metrics literally
In NVIDIA's terminology, utilization.gpu measures the fraction of a sample period with at least one kernel executing. It does not report the fraction of theoretical compute performance achieved. utilization.memory measures time spent reading or writing device memory, whereas memory.used reports occupied framebuffer memory. These are separate concepts. See the nvidia-smi reference.
For a quick, read-only inspection on a compatible NVIDIA host:
nvidia-smi \
  --query-gpu=uuid,name,utilization.gpu,utilization.memory,memory.used,memory.total,power.draw \
  --format=csv
Supported fields depend on the device and configuration. Preserve unsupported or unavailable readings as unknown, not zero. A snapshot is a starting point; use a time series to connect changes to workload phases.
For deeper investigation, DCGM profiling metrics distinguish SM activity, tensor-pipeline activity, and DRAM activity. SM activity includes periods with active warps that may be waiting, so it is not a direct measure of arithmetic throughput. Read each metric's definition and hardware support before interpreting it, and use an application profiler to test a suspected bottleneck.
Define the denominator before reporting a percentage
Consider an illustrative pool of 16 identical, allocatable GPUs over an eight-hour window. Its capacity is 128 GPU-hours. If workloads hold 12 GPUs throughout that window, their allocation is 96 GPU-hours, giving an allocation ratio of 75%.
That calculation says nothing about how much training occurred. It also assumes the pool remained available throughout the window. If nodes entered maintenance or devices became unhealthy, calculate available capacity over time rather than multiplying the final inventory by eight hours.
Define and publish the accounting rules:
- Which clusters, node pools, and accelerator models are included?
- Does allocated mean quota reserved, a pod placed, or a device assigned?
- How are maintenance, reserved service headroom, and unhealthy devices represented?
- Are missing observations excluded, and what fraction of the window has valid telemetry?
- Are full GPUs, MIG profiles, and shared-device slots reported separately?
Do not combine heterogeneous GPUs into a performance-equivalent total without an explicit, validated conversion. Device-hours are an inventory measure, not a universal unit of ML work.
Attribute activity to the correct workload
DCGM Exporter exposes GPU metrics for Prometheus and supports Kubernetes workload mapping. It can also expose physical-GPU and MIG-instance measurements. Check the entity labels before aggregating so that a physical device and its instances are not counted as independent copies of the same capacity.
For operational analysis, connect telemetry to a run identifier, attempt, workload stage, queue, and owner. Preserve that mapping over time: a device used by one job in the morning may belong to another in the afternoon. Joining historical metrics to only the current pod inventory can assign activity to the wrong team.
Shared devices need additional care. NVIDIA documents that DCGM Exporter cannot associate metrics with containers when GPU time-slicing is enabled. Do not copy a device-wide utilization reading onto every sharing pod and sum it. See the time-slicing limitations.
Keep high-cardinality detail in the run record where appropriate, with a deliberate retention policy. A cluster dashboard should make it possible to reach the relevant execution without requiring every artifact path or parameter value to become a metrics label.
Prefer distributions and phases to one fleet average
A fleet average can hide opposite problems. Some devices may be saturated while others are inaccessible because the waiting jobs require a different memory size or topology. Long-running training can also hide short bursts of severe queue delay for interactive work.
Break measurements down by hardware class, workload type, team, and execution phase. Compare data loading, warmup, steady-state computation, evaluation, checkpointing, and teardown separately. A short checkpoint pause should not trigger the same response as hours without application progress.
For distributed jobs, inspect workers together. The average can conceal a slow rank that determines the pace of the entire application. Correlate per-worker progress and timing before concluding that the scheduler needs to change.
Build a small, decision-oriented dashboard
A useful starting dashboard has four views:
- Demand and access: queue wait by workload class, ready workload count, and reasons for admission or placement delay.
- Capacity: allocatable and allocated resource-hours, segmented by accelerator type and sharing mode.
- Execution: application throughput alongside device activity, memory occupancy, and failure or retry events.
- Outcomes: completed runs meeting their acceptance criteria, resource-hours per result, and service latency where applicable.
Keep financial accounting explicit. Multiplying resource-hours by an assumed unit rate gives an estimate under that rate, not necessarily the invoice. Recovering idle capacity creates scheduling headroom; it becomes a cash saving only when it reduces billable infrastructure, avoids additional purchases, or changes another actual expense.
Polyaxon's run context and resource scheduling configuration provide the workload side of this analysis. Combine that context with your infrastructure telemetry rather than treating a device-level percentage as the complete execution record.
Once the measurements identify the bottleneck, use the GPU utilization improvement guide to choose an intervention. If most delay occurs before execution, start with GPU orchestration and the scheduler comparison.