LLM cost monitoring: Measure cost per successful task
Connect tokens, model calls, retrieval, tools, retries, and infrastructure with quality and task outcomes to control production LLM costs.
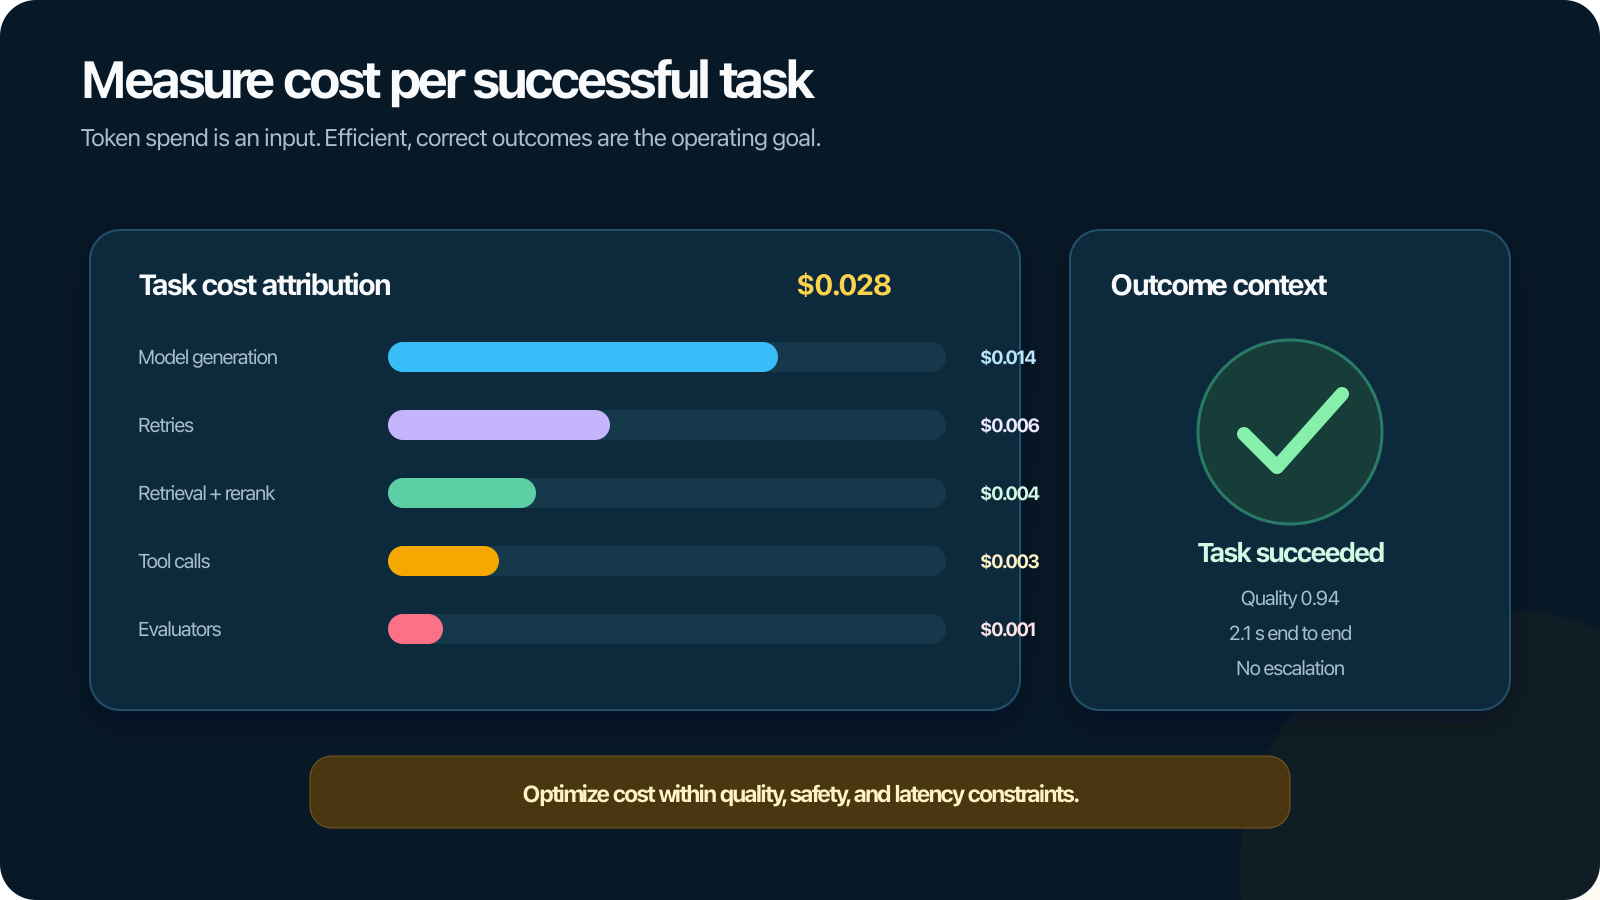
An LLM application's monthly bill can increase because traffic grew, prompts became longer, an agent entered more loops, retrieval returned more context, a fallback model activated, or a new release completed fewer tasks successfully.
A provider invoice cannot distinguish those causes. LLM cost monitoring connects spend with the application version, trace, operation, user segment, quality, and final outcome so teams can optimize the system rather than simply reduce model usage.
What is LLM cost monitoring?
LLM cost monitoring is the practice of measuring, attributing, and analyzing the resources consumed by generative AI applications and agents.
It includes direct model usage and the surrounding system:
- Input, cached, reasoning, and output tokens where reported.
- Model, embedding, reranking, speech, or image operations.
- Retrieval queries and vector or search infrastructure.
- Tool calls and third-party API charges.
- Retries, fallbacks, routing, and agent loops.
- Compute, accelerators, storage, and network for self-hosted components.
- Evaluation and human-review cost.
- Failed or abandoned tasks.
The useful unit is usually not cost per API call. It is cost per completed or successful task, segmented by the factors a team can change.
Why call-level spend is misleading
Consider two support-agent versions:
| Version | Model cost per call | Calls per task | Task success | Cost per successful task |
|---|---|---|---|---|
| A | Lower | Higher because of retries | Lower | Potentially higher |
| B | Higher | Lower with better tool selection | Higher | Potentially lower |
Optimizing the cheapest call can increase total spend if it causes more model steps, tool use, or human correction. Conversely, a more capable model may reduce the complete workflow cost.
Measure cost with quality, latency, and outcome. A cost reduction that increases unsafe actions or unresolved requests is not an optimization.
Instrument the complete cost path
Assign one task or trace boundary
Define the unit whose cost matters: a response, conversation turn, user task, agent run, document, or workflow. For agents, a logical task often spans several requests and services.
Use a trace ID to connect every operation and a session ID to group related tasks where appropriate.
Record model usage
For every model operation, capture provider, model, operation type, input and output units, cache behavior, latency, status, retry, and price or pricing-table version used for estimation.
Provider pricing changes over time. Preserve the unit usage separately from the computed currency amount so historical cost can be audited or recalculated.
Record retrieval and context
Track embedding operations, search queries, reranking, documents retrieved, documents sent to the model, and context size. Large context can increase model cost even when retrieval itself is inexpensive.
Record tools and external services
Attach tool name, provider, calls, retries, latency, and metered cost where available. A cheap model that calls an expensive search or data service repeatedly can dominate the task budget.
Record application and infrastructure cost
For self-hosted models or components, allocate compute, accelerator, memory, storage, and network cost using a documented method. Separate idle capacity from marginal request cost so comparisons remain meaningful.
Attach quality and outcome
Connect the trace with evaluation results, user feedback, task state, escalation, and business outcome. This enables metrics such as cost per grounded answer, resolved ticket, approved action, or successful workflow.
Core cost metrics
Total cost
Use total cost for budgeting and anomaly detection, segmented by environment, application, team, tenant, provider, and release.
Cost per task
This normalizes spend by workload. Define the task carefully and track its distribution, not only the average.
Cost per successful task
Divide the cost of all attempts—including failures—by the number of tasks that meet the success criterion. This metric exposes systems that look inexpensive per call but waste work.
Cost by operation
Break down generation, embeddings, reranking, tools, evaluation, and infrastructure. Focus optimization on the dominant contributor.
Tokens and calls per task
These are useful leading indicators and remain comparable when pricing changes. Segment them by prompt, model, agent, tool, and outcome.
Retry and fallback cost
Track the amount and share of spend caused by provider retries, schema repair, tool failures, guardrail retries, model escalation, and loop behavior.
Evaluation cost
Measure model-based judges, simulations, and human review separately. Evaluation protects quality but needs its own sampling and budget strategy.
Cost-quality frontier
Compare application versions across both cost and quality. A useful change improves quality at similar cost, reduces cost at similar quality, or makes a deliberate tradeoff that stakeholders accept.
Allocate cost through traces
The trace is the natural cost ledger for an LLM application. Each span records usage and estimated cost for one operation; the parent trace aggregates the complete task.
Useful attributes include:
- Application, release, prompt, agent, and policy versions.
- Provider, model, region, and operation.
- Input, output, cached, or other reported units.
- Tool, retrieval, and external service identifiers.
- Retry, fallback, and cache status.
- Tenant, task, and bounded user segment.
- Evaluation result and task outcome.
Avoid putting high-cardinality identifiers or prompt content in metric labels. Keep detailed context on traces and use controlled dimensions for dashboards and alerts.
Build cost dashboards that support decisions
A useful dashboard should answer:
- Which applications and releases drive the change in spend?
- Did traffic, unit usage, price, retries, or success rate change?
- Which model, prompt, tool, or retrieval configuration is responsible?
- What is the cost distribution by task and segment?
- How much spend goes to failed, abandoned, or escalated tasks?
- Are quality and latency improving or declining with cost?
- Which traces explain the largest or most unusual costs?
Start with the total trend, then support drill-down to version, operation, and trace. A dashboard without trace examples can identify a symptom but not the fix.
Set budgets and alerts
Application and team budgets
Allocate budgets by application, environment, team, or tenant. Include forecast and remaining budget so owners can act before exhaustion.
Per-task budgets
Define expected cost ranges by task class. A research workflow and a short classification request should not share the same threshold.
Anomaly alerts
Alert on sudden changes in tokens, calls, retries, fallback rate, tool cost, or successful-task cost. Compare with release and traffic changes before treating every increase as an incident.
Guardrails
Use maximum steps, tokens, wall time, or cost to stop runaway agent loops. High-impact tasks may require an explicit approval before crossing a larger budget.
Burn-rate policies
For a fixed period budget, monitor how quickly it is being consumed and define actions for rapid burn: investigate a release, adjust sampling, limit a feature, or route traffic differently.
Optimize cost without losing quality
Reduce unnecessary context
Improve retrieval precision, remove repeated instructions, summarize safe conversation history, and avoid sending unused tool schemas. Reevaluate groundedness and task success after the change.
Route by task
Use smaller or faster models for bounded tasks and stronger models for complex or high-risk work. Base routing on validated task categories and preserve fallback evidence.
Cache carefully
Cache stable embeddings, retrieval results, prompt prefixes, or deterministic responses where semantics and provider capabilities allow. Include version, permissions, and freshness in cache keys.
Fix loops and retries
Trace repeated model and tool spans. Add explicit stopping conditions, structured tool errors, state verification, and retry budgets.
Batch or parallelize appropriate work
Batch evaluation and embedding workloads, and parallelize independent retrieval or tool operations. Verify that concurrency does not increase duplicate actions or rate-limit failures.
Improve success on the first attempt
Better instructions, tool schemas, retrieval, and model selection can be more valuable than negotiating a lower price per token. Measure the complete task.
Example: diagnosing a post-release cost increase
A support agent's daily spend rises 35% after a prompt release while traffic stays stable.
The dashboard shows that the model price and output tokens did not change. Calls per task increased from three to five, and tool retries doubled. Trace comparison reveals that the new prompt tells the agent to verify every tool result but does not expose the verification state, causing the same lookup to repeat.
The team adds a state field, updates the stopping rule, and creates a regression case with a maximum call count. The candidate restores the previous cost per successful task while preserving the improved verification behavior.
Cost monitoring turned a billing symptom into a specific state and orchestration defect.
Common LLM cost-monitoring mistakes
Tracking only the provider invoice
Invoices lack application, version, task, and outcome context. Attribute usage at request time and reconcile it with billing data.
Using average cost alone
Long tails and runaway traces can hide behind a stable average. Track percentiles, maxima, and the share of spend from expensive tasks.
Ignoring failed work
Retries, abandoned sessions, failed tools, and unsuccessful tasks consume resources. Include them in successful-task cost.
Hard-coding current prices into historical events
Store usage units and the pricing version. Preserve how the original estimate was calculated.
Optimizing cost without a quality guardrail
Every optimization experiment should rerun quality, safety, latency, and task-success evaluation.
Giving cost labels unbounded cardinality
Keep unique IDs and detailed content on traces. Aggregate metrics on bounded dimensions.
Polyaxon and the cost-observability roadmap
Polyaxon's tracking and orchestration capabilities provide a foundation for logging versioned usage and cost metrics, comparing experiments, automating evaluation, and monitoring the infrastructure behind AI workloads.
Full LLM and agent observability is an active area on the Polyaxon roadmap, alongside an AI gateway, evaluations, prompt management, and agent sandboxing. The direction is to connect provider usage, model and tool spans, evaluation results, and task outcomes in one trace and cost view.
Optimize the completed task
Tokens and model calls matter, but they are inputs to a user outcome. Monitor cost at the same boundary where quality and success are measured.
When spend is connected to agent traces, versions, retries, and outcomes, teams can distinguish healthy growth from waste and make deliberate cost-quality tradeoffs instead of reacting to a monthly bill. An AI gateway can provide the shared provider and routing controls behind that view.