Managed Prometheus for ML platforms
Decide between managed and self-operated Prometheus using scale, availability, PromQL compatibility, data governance, cost, and operational ownership.
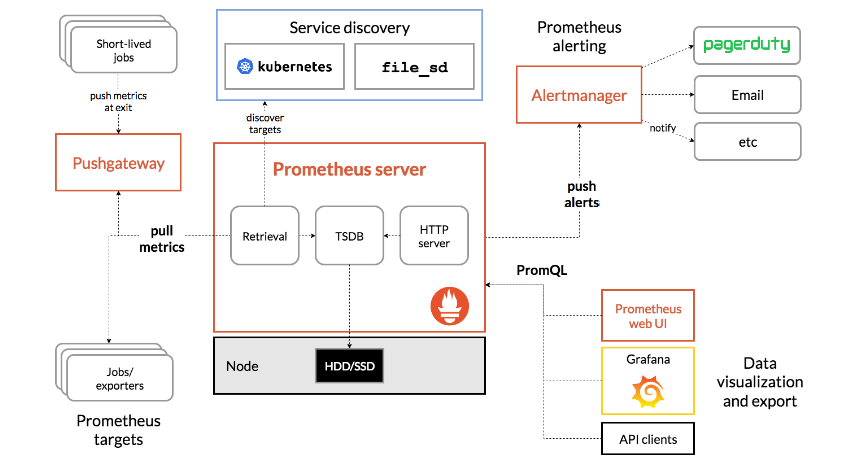
A managed Prometheus service operates some or all of the metrics backend: ingestion, durable storage, scaling, upgrades, and availability. Your team still owns instrumentation, scrape or write configuration, label design, recording rules, alerts, dashboards, access, and cost control.
The decision is not simply “run servers or pay a vendor.” Define the operational boundary and verify that the service preserves the Prometheus behavior your workloads and incident process require.
Separate collection from long-term storage
Prometheus traditionally discovers targets, scrapes metrics, evaluates rules, stores local time series, and sends alerts. The official storage documentation explains the local time-series database and its operational limits.
A managed design can take several shapes:
- local Prometheus scrapes and sends samples to remote storage;
- an agent-oriented collector discovers and forwards samples without serving full local queries;
- a provider-managed collector performs scraping;
- self-operated Prometheus remains the short-term query and rule layer while remote storage provides durable global history.
Choose deliberately. Local data can preserve debugging capability during a remote outage, while a thinner collection layer reduces infrastructure to operate.
Define what “managed” includes
Ask who owns each function:
| Function | Questions |
|---|---|
| Collection | Who configures discovery, authentication, relabeling, and scrape capacity? |
| Ingestion | What limits, backpressure, retries, and ordering rules apply? |
| Storage | What retention, replication, backup, and regional guarantees exist? |
| Query | Which PromQL features, limits, and consistency behavior are supported? |
| Rules | Where do recording and alerting rules run, and how are they deployed? |
| Notifications | Who operates Alertmanager and validates delivery? |
| Access | How do identity, tenancy, audit, encryption, and private networking work? |
Do not assume dashboards or alerts are automatically correct because storage is managed. The platform team remains responsible for what the metrics mean.
Validate Prometheus compatibility
Test existing PromQL, recording rules, alerting rules, service discovery, remote-write behavior, exemplars, native histograms, metadata, and label limits against a candidate service.
The Prometheus remote write configuration exposes queue, retry, relabeling, authentication, and endpoint controls. Provider limits may still differ in accepted samples, labels, series, request size, or out-of-order behavior.
Run representative queries across recent and retained data. A service can accept samples successfully while producing different query performance or rule timing under production cardinality.
Model availability end to end
A durable managed backend does not make collection automatically highly available. Duplicate scrapers, target discovery, network paths, credentials, write queues, and rule evaluators each need a failure model.
Verify how the system handles:
- collector or cluster failure;
- temporary loss of the managed endpoint;
- duplicate samples from high-availability collectors;
- delayed or rejected writes;
- regional disruption;
- expired credentials;
- backend ingestion or query limits.
Monitor accepted, retried, dropped, and pending samples. A silent remote-write failure must not look like zero workload activity.
Keep alert delivery independently observable. Our Prometheus Alertmanager guide covers routing, grouping, inhibition, silences, and notification ownership.
Control cardinality before export
Managed services make it easy to ingest more data, which can make poor label design more expensive rather than less operationally harmful.
Use bounded dimensions such as service, environment, cluster, namespace, workload class, queue, model family, and status. Avoid unique run IDs, Pod UIDs, user-provided labels, prompts, file paths, and artifact digests in broad metric labels.
Keep high-cardinality identifiers in logs, traces, or Polyaxon run metadata and link them from dashboards. Apply metric and label allowlists before remote write so unwanted series do not enter a billable or regulated backend.
Evaluate governance and cost
Metrics can reveal tenant names, workload topology, resource usage, model identifiers, and infrastructure capacity. Verify data location, encryption, tenant isolation, audit logs, deletion, retention, and contractual exit behavior.
Model cost from active series, ingestion rate, samples, retention, query volume, recording rules, replication, and network transfer—not only a headline price. Include engineering time for self-operation and migration.
Long retention is valuable only when teams query it. Downsample or record stable aggregates where appropriate, and keep raw high-resolution data for the period supported by incident and capacity-planning needs.
Preserve an exit path
Keep instrumentation and collection based on open protocols and Prometheus-compatible formats where practical. Version rules and dashboards outside the provider UI. Document how to redirect writes, export required historical data, rotate credentials, and operate during migration.
Portability does not require ignoring useful managed features. It requires knowing which parts are standard, which are provider-specific, and what replacing them would cost.
Connect metrics to Polyaxon
Polyaxon platform observability provides metrics and health context for the services managing workloads. Polyaxon run metadata connects aggregated infrastructure signals to projects, operations, parameters, logs, metrics, and artifacts without placing every unique run identifier into Prometheus.
Choose managed Prometheus when the service's operating boundary, compatibility, availability, governance, and total cost improve the platform. Keep self-operated components where they provide necessary control or resilience. In both cases, trustworthy labels and actionable rules remain your responsibility.