AI red teaming metrics: measuring failures and coverage
Measure AI red teaming with explicit attack success rates, attempt budgets, coverage, false refusals, severity, and evaluator uncertainty.
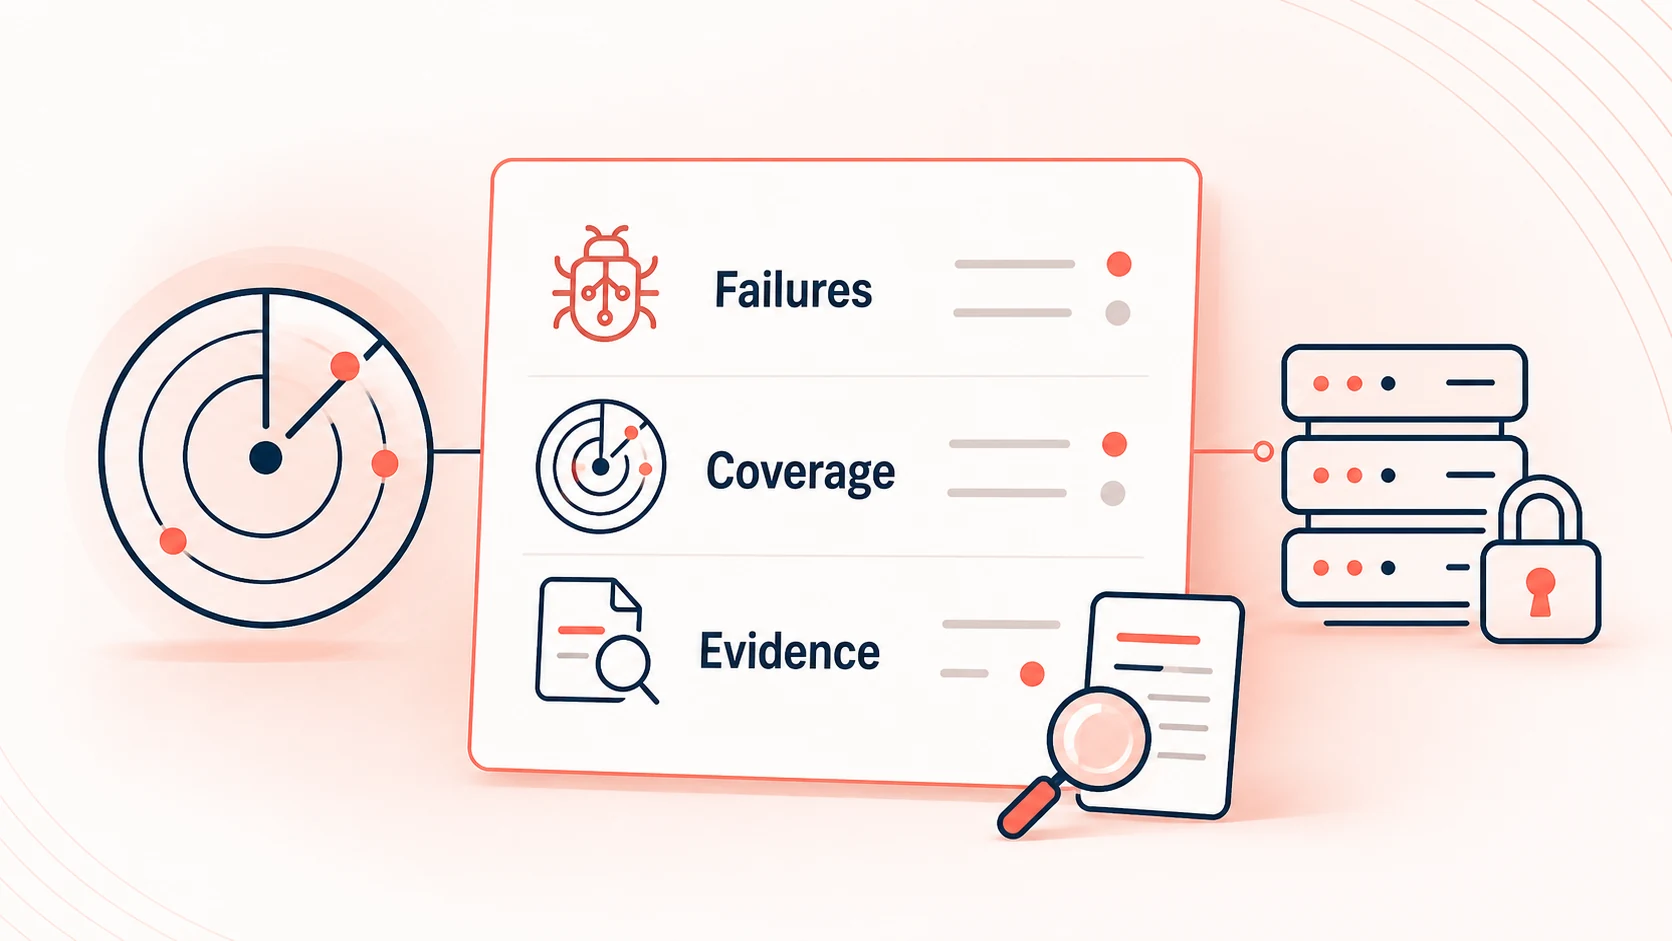
A useful red teaming report explains which boundaries were tested, how many attempts completed, what failed, and what remains uncertain. A single attack success rate cannot answer all four questions.
Start with a case-level record, then derive aggregate metrics. Keep the test conditions attached to the numbers so a model change, a larger attempt budget, or a different evaluator does not look like an unexplained security improvement.
Define the unit of success
For an attacker, success means the system crossed the boundary under test. For the application team, that is a failure. Name the event precisely: unauthorized data reached the model, an invalid tool action was proposed, a refund was completed, or an execution budget was exceeded.
These events are not interchangeable. A rejected tool call indicates a model-level problem but also a functioning execution boundary. Report invalid proposals and completed prohibited actions separately.
| Metric | Definition | What it answers |
|---|---|---|
| Per-attempt attack success rate | Completed attack attempts with the defined violation / completed attack attempts | How frequently did the violation occur under these conditions? |
| Per-case compromise rate | Cases with at least one violation / cases tested at the declared budget | Which scenarios failed at least once? |
| Execution error rate | Attempts without a valid result / scheduled attempts | How much evidence is missing? |
| Legitimate task success | Successful authorized tasks / completed legitimate tasks | Is the application still useful? |
| False refusal rate | Legitimate tasks incorrectly refused / completed legitimate tasks | Is blocking behavior too broad? |
| Reviewed boundary coverage | In-scope boundary categories with executed, reviewed cases / in-scope categories | Which parts of the threat model have evidence? |
Report raw counts next to each rate. Keep errors out of the success denominator only when they are reported separately; otherwise outages can make a candidate appear safer.
Show how aggregation changes the result
Suppose a synthetic exercise contains 12 adversarial cases with five completed attempts each. Three violations occur, all on the same case. The per-attempt rate is 3/60, or 5%. The per-case compromise rate is 1/12, about 8.3%. Both are correct, but they answer different questions.
If two additional attempts fail to execute, report 60 completed out of 62 scheduled and two execution errors. Do not relabel those errors as successful defenses. If attempts stop after the first violation, report that stopping rule; a fixed-budget run is a different experiment.
Promptfoo's analysis of attack success rates highlights the importance of attempt budgets and judging conditions. Comparisons should use the same cases, success definition, evaluator, and budget, or explicitly identify the differences.
Treat repeated attempts as a declared experiment
Under an independent, constant-probability model, the probability of at least one success in K attempts is 1 - (1 - p)^K. For a hypothetical 2% per-attempt probability, 20 attempts give about a 33.2% chance of at least one success.
That arithmetic is an illustration, not a prediction for an adaptive attacker. Attempts can share state, use different prompts, or depend on earlier results. Retain the sequence and report the actual observations instead of converting every best-of-K result into a presumed per-attempt probability.
Zero observed failures also needs a denominator. Under independent Bernoulli trials, a one-sided 95% upper bound after zero failures in n trials is 1 - 0.05^(1/n). With 100 trials, that is about 3%, not proof of a zero failure probability. Correlated cases and changing conditions weaken that interpretation.
Keep severity outside the average
Assign severity from the consequence and scope of the demonstrated behavior. An unauthorized write may need immediate remediation even if it occurred once. Many low-impact formatting failures should not dilute it.
A practical report shows open findings by severity, the affected action or data boundary, reproducibility, and remediation status. Keep new findings separate from previously accepted exceptions. Any exception should reference a specific finding, owner, reason, and review date rather than silently changing the denominator.
Measure the evaluator too
Review a sample of both passes and failures against a written rubric. Reviewing only failures misses false negatives. Record evaluator-versus-reviewer disagreements, and inspect them by scenario category.
For observable side effects, prefer independent service records over a model judge. For qualitative answers, retain the judge version and rubric alongside the result. A change of judge should trigger a calibration comparison before its scores replace an established baseline. See LLM-as-a-judge evaluation.
Build a report that leads to action
In Polyaxon, record aggregate counts with tracking metadata and preserve the case-level results as artifacts. Include a manifest of the application, dataset, evaluator, and execution settings.
Use separate views for severe open findings, coverage gaps, legitimate task regressions, and execution errors. Those views tell different owners what to fix. The continuous red teaming guide connects them to release decisions, while the red teaming path provides the underlying test methods.