Compare runs across synchronized charts
Compare six experiments at the same epoch, zoom across metric charts together, and configure tooltips with multiple live metric columns and run parameters.
Training loss can keep falling while validation loss becomes noisy. In Polyaxon, you can move one cursor across a dashboard to inspect several metrics at the same training step, then zoom into the same interval across charts.
Synchronized cursors and shared brush selections have been available since v2.14. This walkthrough uses the current UI, with six experiments and six measured metrics.
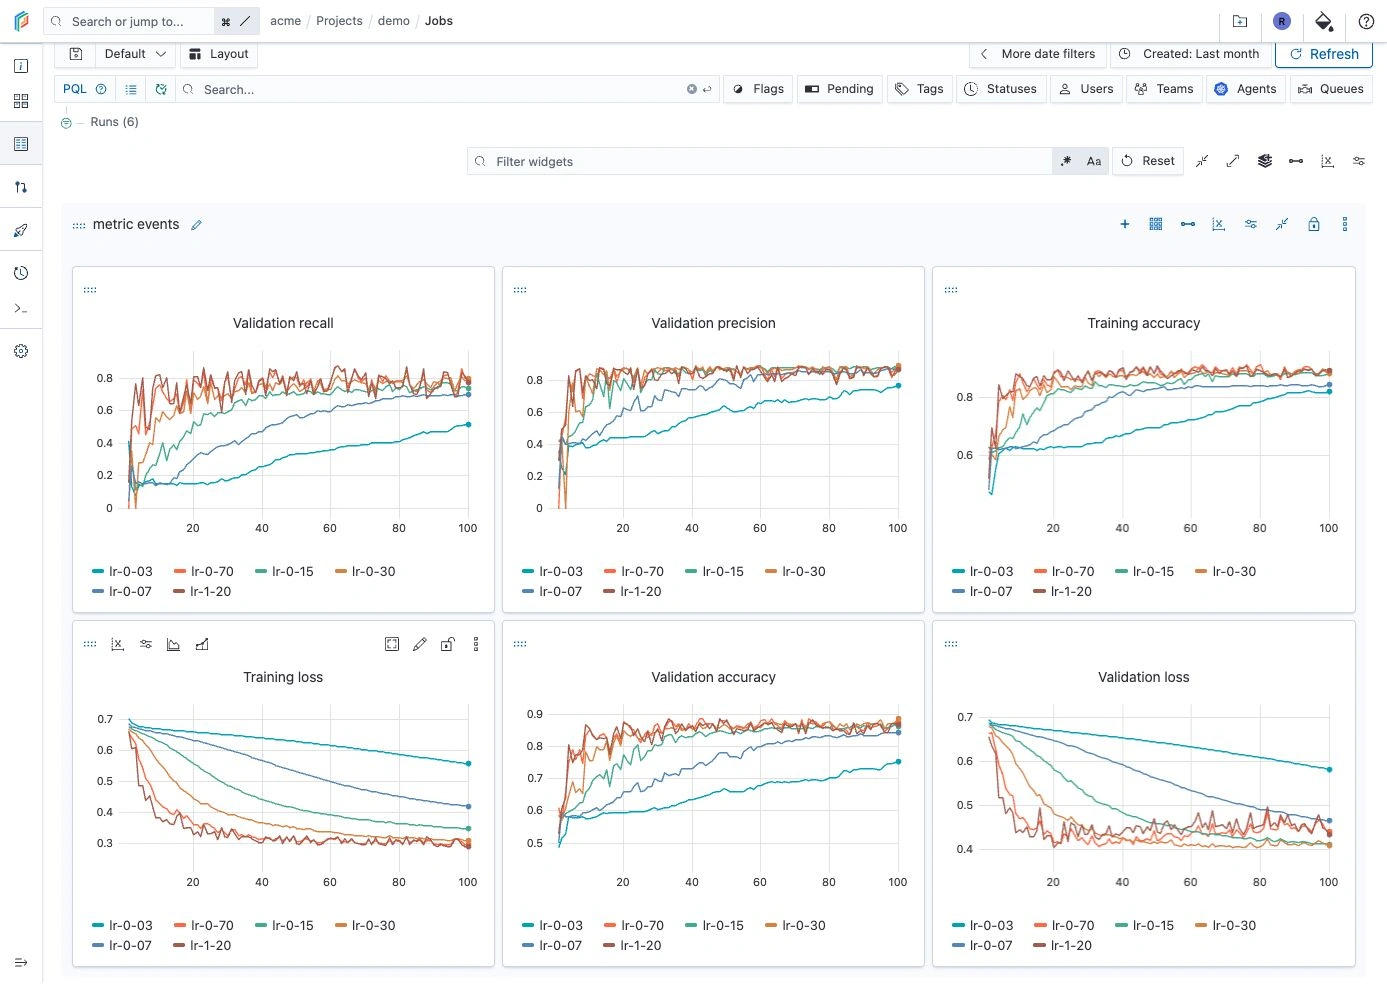
Put related metrics on the same axis
For these screenshots, we trained a small classifier on generated data for 100 epochs. The six runs use learning rates of 0.03, 0.07, 0.15, 0.30, 0.70 and 1.20, with the same data, initialization and batch order. These are actual CPU training runs created for the demonstration, not a model benchmark.
Each run records training loss and accuracy, plus validation loss, accuracy, precision and recall. All six values use the epoch as their step. In an existing training script, initialize tracking once and log the metrics at the end of each epoch:
from polyaxon import tracking

tracking.init()

# At the end of each epoch in your training loop:
tracking.log_metrics(
    step=epoch,
    train_loss=train_loss,
    train_accuracy=train_accuracy,
    val_loss=val_loss,
    val_accuracy=val_accuracy,
    val_precision=val_precision,
    val_recall=val_recall,
)
Open the project's runs page, select the runs to compare, and enable Events in Layout. Add a line chart for each metric. Set Xaxis to step and Tracename to run_name so the legends identify the experiments.
Use a consistent meaning for step: epoch 60 should mean the same amount of training in every run. A step axis aligns logged coordinates; it does not account for different dataset sizes or batch sizes.
Inspect one epoch across the dashboard
Move the pointer over a chart. The linked cursors and tooltips show the corresponding step across the other metric charts, with the same run colors throughout.
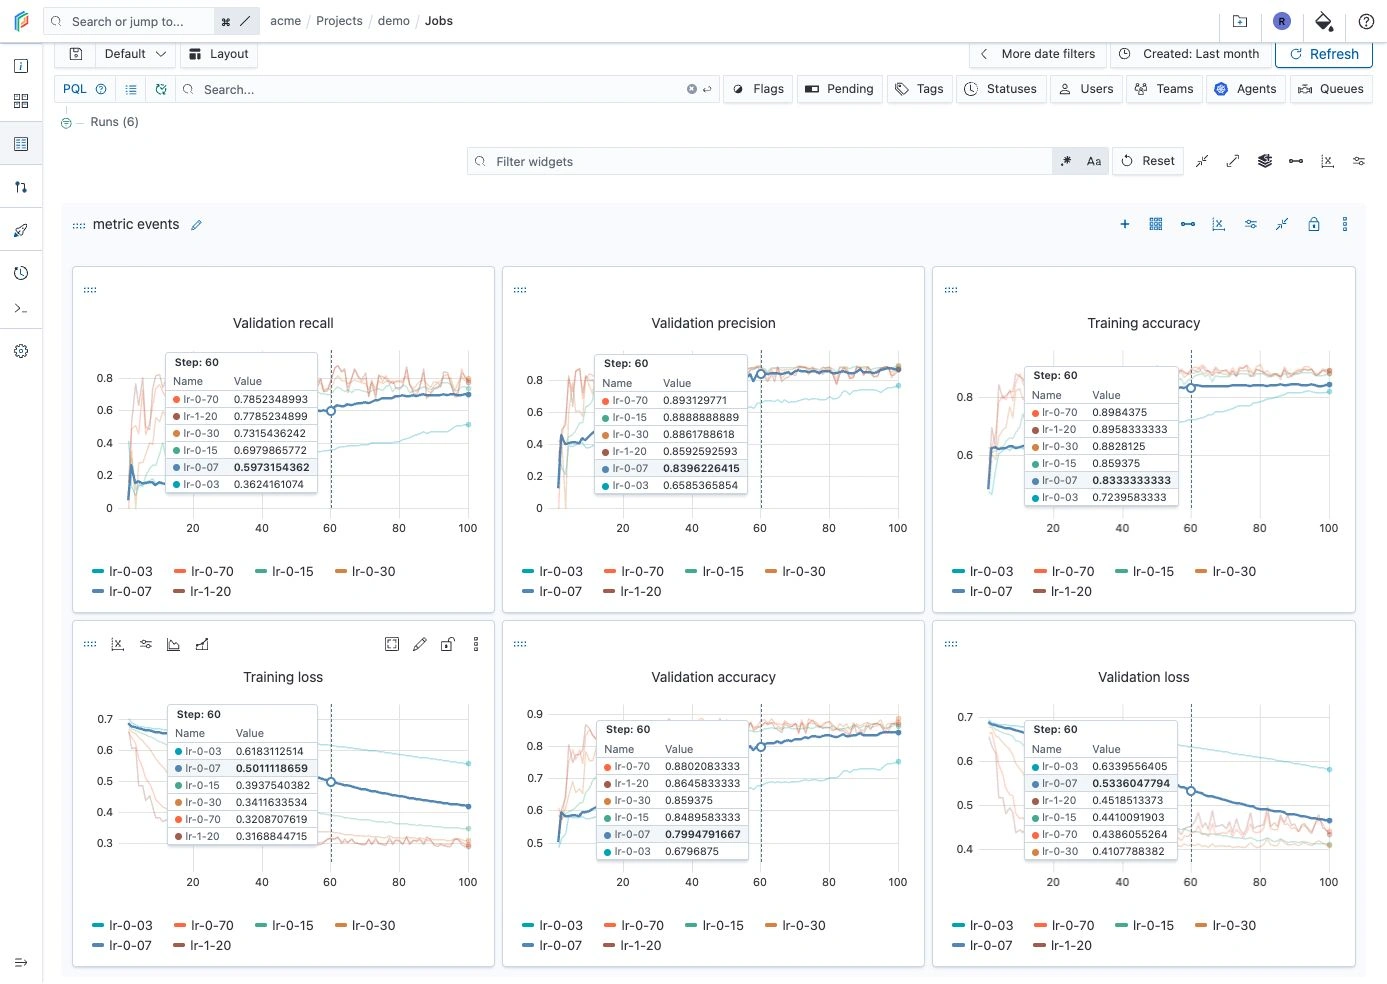
At epoch 60, the 0.70 run has lower training loss than the 0.30 run: about 0.321 versus 0.341. Its validation loss is higher, however: about 0.439 versus 0.411. Reading both charts at the same epoch makes that difference visible without switching between run pages.
Zoom into one interval across charts
Drag horizontally inside a plot to select a training interval. The other metric charts zoom to that same x-axis range. You can inspect a noisy stretch of validation loss while keeping accuracy, precision and recall on the same interval.
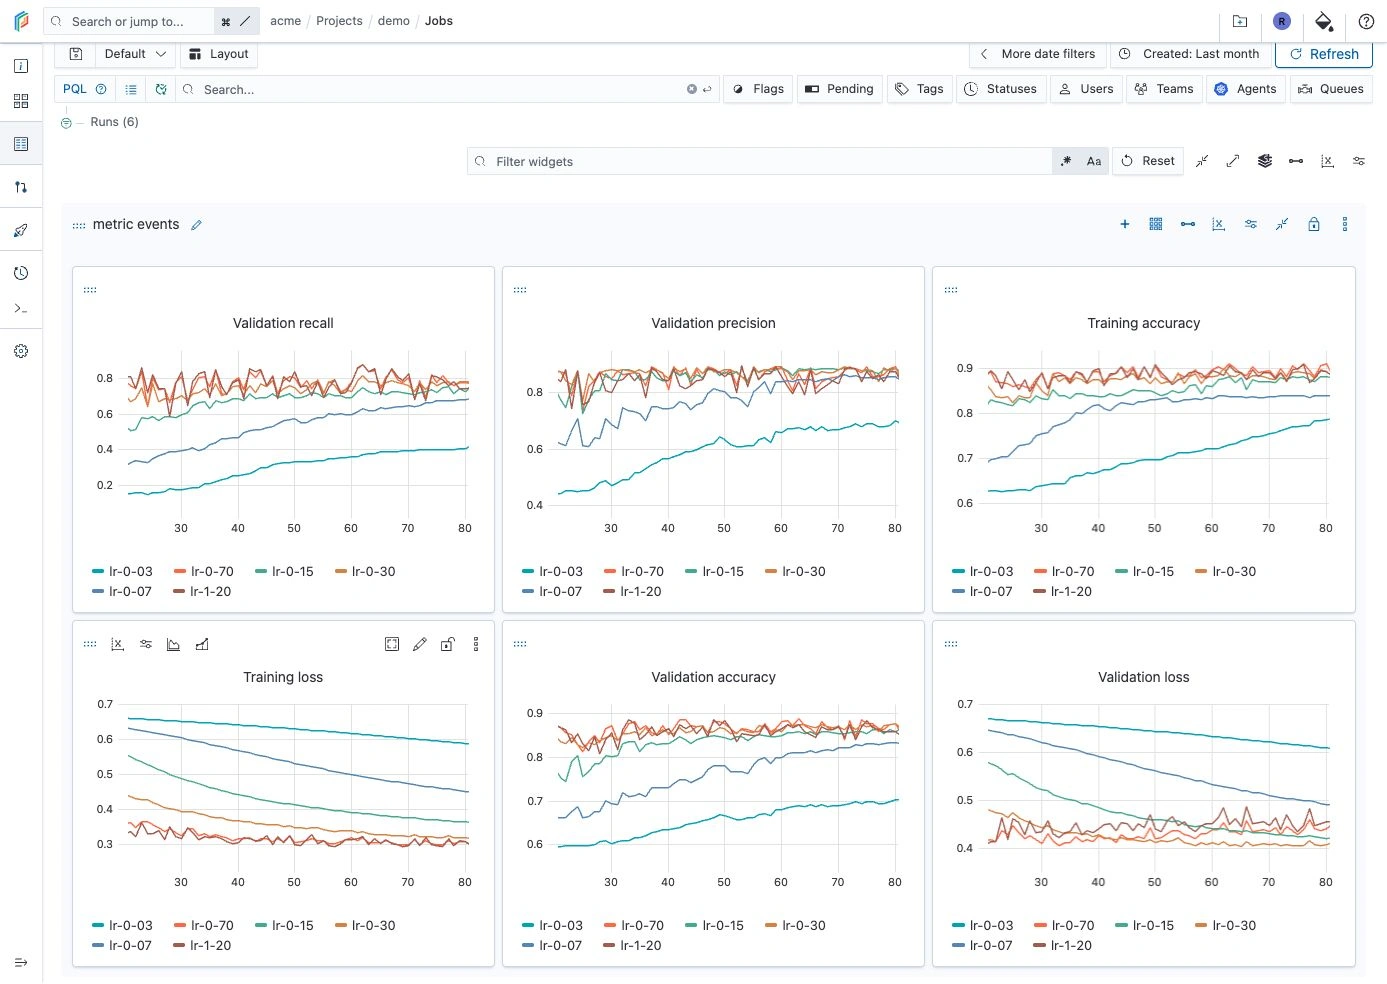
Double-click inside a plot to restore the full range.
Show several metric values in one tooltip
You can also compare training and validation loss in one tooltip, with one row per run and a separate column for each metric.
Open the line widget's Edit panel. Under Data, select both train_loss and val_loss in Metrics. Keep Xaxis set to step and Tracename set to run_name.
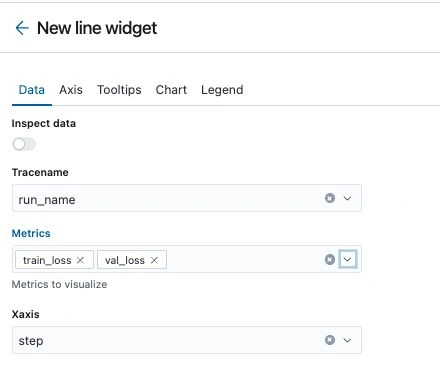
Under Tooltips, add train_loss, val_loss and learning_rate to Tooltip info, then click Save. Selecting both loss fields keeps them available as columns when you move between their curves.
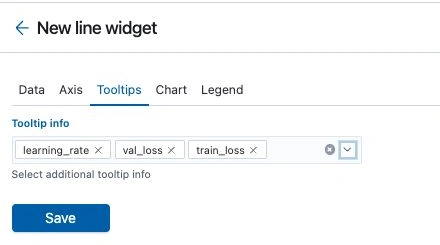
Move the pointer across the chart. Both loss columns update to the inspected epoch; learning_rate stays fixed for each run. The detail below shows all six runs at epoch 60.
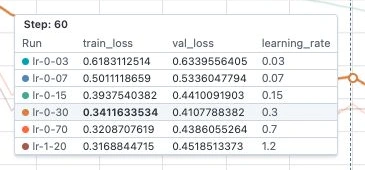
Include the metrics under Data → Metrics when you want their per-step values. A metric added only as an extra run field can show its recorded summary instead. Parameters such as learning rate provide run context rather than a changing time series.
Click to pin a tooltip for inspection, and press Escape to unpin it. Use the widget's fullscreen control when you need more room for the curves and columns.
For the surrounding workflow, see run comparison and tuning PyTorch models with Polyaxon.