How to use Kubernetes metrics
Find Kubernetes CPU, memory, object-state, and control plane metrics, and read them correctly with kubectl and your monitoring tools.
Kubernetes emits plenty of metrics. Most of them are noise until they answer a specific operational question: which pod is throttled, which node is saturated, which queue is blocked, or which workload changed after a rollout.
For ML platforms, metrics matter most when they connect infrastructure behavior to run context. CPU, memory, GPU, and storage signals are more useful when you can tie them back to the experiment, service, or pipeline that caused them.
This guide explains where the main signals come from and how to inspect them. For decisions about capacity, scheduling, and alerts, continue with how to leverage Kubernetes metrics.
Kubernetes resource metrics overview
CPU, memory, and storage are finite resources, so monitoring their use is an early step toward understanding workload performance. The standard Kubernetes resource Metrics API covers CPU and memory; disk, network, GPU, and application measurements require additional telemetry.
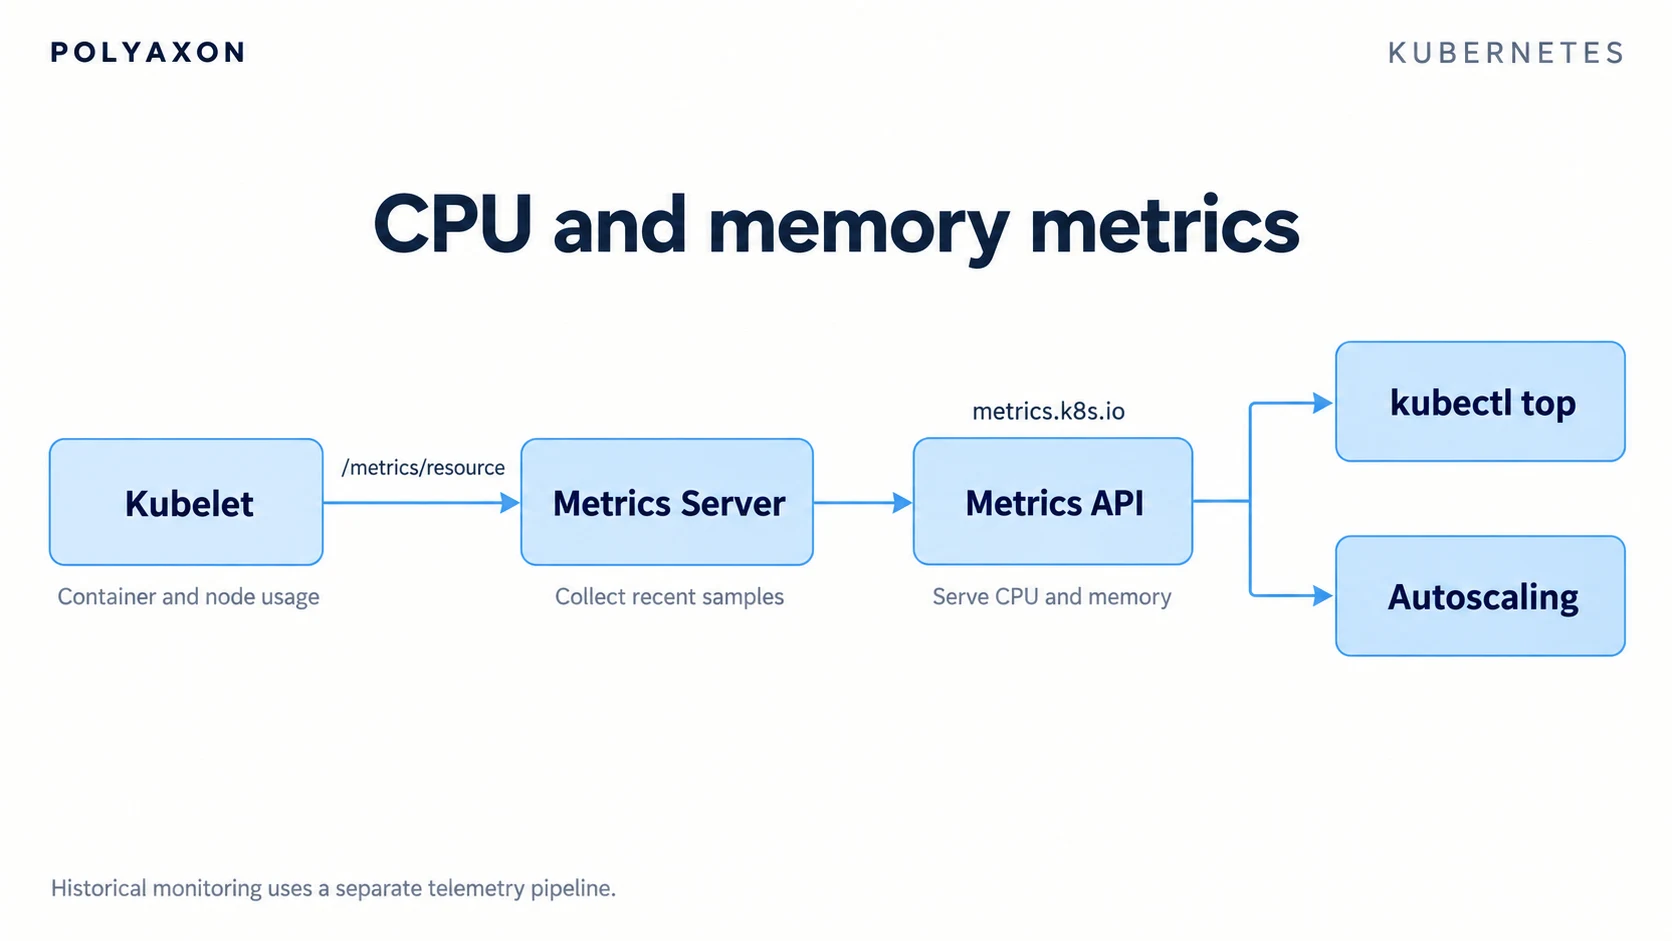
The diagram follows resource data from nodes to its consumers.
The kubelet obtains container statistics through cAdvisor or supported container-runtime interfaces.
It exposes resource metrics at /metrics/resource; the separate Summary API is at /stats/summary.
Metrics Server collects recent CPU and memory samples from kubelets and serves them through
metrics.k8s.io. Versions 0.6.0 and later use /metrics/resource; older versions used the Summary API.
See the resource metrics pipeline.
The Metrics API allows you to access the CPU and memory for the nodes and pods in your cluster, and it feeds metrics to the Kubernetes autoscaling components, which are important for most use cases.
Metrics Server enables commands such as kubectl top nodes and resource-based autoscaling. It is
not a prerequisite for Prometheus and is not a historical monitoring store. A monitoring system
scrapes the relevant kubelet, exporter, and component endpoints separately. The
Metrics Server project explains its intended scope
and installation requirements.
Tracking resource metrics and availability is important in ensuring that end users can access your applications. CPU utilization, available vs. used memory, and storage are finite resources, and metrics can be used to determine the load on the servers and whether additional resources must be added to the cluster. These metrics can also indicate when resources are overprovisioned and there could be an opportunity to reduce usage and costs.
Cluster state metrics overview
The Kubernetes API stores object specifications and status. kubectl reads those objects directly;
kube-state-metrics watches them and exposes their state as Prometheus metrics. This tells you about
desired and observed state, such as unavailable replicas, rather than measured CPU consumption.
Node status is a popular cluster state metric. For example, in Kubernetes, node conditions might
include Ready, MemoryPressure, DiskPressure, and more. In kube-state-metrics, the following
metric
name returns the status of the node: kube_node_status_condition
Select its condition and status labels when interpreting node conditions. For example,
kube_node_status_condition{condition="MemoryPressure",status="true"} is 1 when that condition is true.
For workload availability, use the metric for the relevant controller:
| Controller | Metric | Meaning |
|---|---|---|
| Deployment | kube_deployment_status_replicas_available | Available replicas |
| Deployment | kube_deployment_status_replicas_unavailable | Unavailable replicas |
| DaemonSet | kube_daemonset_status_number_unavailable | Nodes that should run a daemon Pod but do not have an available one |
Availability depends on controller status and readiness; it is not an application latency or quality measurement. Check the kube-state-metrics catalog for the metric names and labels supported by your version.
Control plane metrics overview
As mentioned previously, Kubernetes provides metrics for the core control plane components, including the API server, controller managers, schedulers, and etcd. These control plane components are critical for ensuring cluster management, so tracking the availability and performance of these components is essential.
Here are a few control plane metrics that you should consider monitoring:
etcd_server_has_leader: whether an etcd member sees a leader. A 0 warrants investigation; a 1 alone does not establish that every member or request is healthy.apiserver_request_duration_seconds: a histogram of API request duration. Its_countseries counts observations; use its buckets or sum/count appropriately to study duration.scheduler_schedule_attempts_total: a counter of scheduling attempts by result. It measures attempts, not latency.scheduler_scheduling_attempt_duration_secondsmeasures attempt duration.
Metric names are case-sensitive. Availability and labels depend on the component version and your provider's access policy. Consult the Kubernetes metrics reference and etcd metrics documentation; managed clusters may not expose every control plane endpoint to tenants.
Accessing resource metrics with Kubectl
Kubectl is a powerful command-line tool that allows engineers to perform a large number of actions on a Kubernetes cluster, without needing to make API calls directly.
Start with a configured kubeconfig and read permission for the relevant resources. kubectl top
also needs a working Metrics API. Ordinary get and describe commands can inspect object state
even when the metrics pipeline is unavailable.
Using Kubectl get
After deploying Metrics Server, use the metrics API's fully qualified resource name to read a Pod's metrics. This lets API discovery choose a version supported by the server:
Using the following command, you can retrieve a pod's resource metrics:
kubectl get pods -n default
kubectl get pods.metrics.k8s.io demo-pod -n default -o json
Replace demo-pod and default with an existing Pod and namespace. To inspect the API group's
served versions directly, use kubectl get --raw /apis/metrics.k8s.io.
The result includes per-container usage, a timestamp, and a measurement window. CPU is average
core usage over that window; memory is a working-set estimate at collection time. These are not the
container's resource requests or limits.
Using Kubectl top
With a properly installed Metrics Server, you can use the kubectl top command to pull metrics for
pods, nodes, and even individual containers.
To retrieve node usage:
kubectl top nodesSimilarly, inspect one namespace, individual containers, or all namespaces:
kubectl top pods --namespace default
kubectl top pods --namespace default --containers
kubectl top pods --all-namespaces --sort-by=memory
250m means one quarter of a CPU core; 512Mi means 512 MiB. Fresh Pods may not have a sample yet.
If metrics are unavailable for the whole cluster, inspect Metrics Server's API registration, logs,
and kubelet connectivity before interpreting missing data as zero usage.
Using Kubectl describe
If you're interested in knowing more about how resources are allocated within nodes, you can use the
kubectl describe node <NODE_Name> command to learn more.
The command works with or without Metrics Server. Its non-terminated Pods and allocated resources
sections summarize configured requests and limits against the node's allocatable resources. They do not report live
usage. Compare these allocations with top and historical telemetry when investigating capacity.
kubectl get nodes
kubectl describe node worker-1
Replace worker-1 with the node you want to inspect. Conditions and events can explain why a node
is unavailable even when its last CPU reading was low.
Accessing the Kubernetes dashboard
Web interfaces can put object status, resource usage, and recent events beside one another. The original Kubernetes Dashboard project is archived and no longer maintained; do not treat its old installation instructions or historical charts as current Kubernetes defaults. The project's README points users to Headlamp.
Whichever interface your team uses, check where its measurements come from and how long they are retained. A UI backed by recent Metrics API samples does not replace a historical store. Use your monitoring backend for time ranges that span rollouts, incidents, and workload changes.
Final thoughts
Kubernetes metrics are useful when they answer a concrete question. CPU, memory, pod state, control plane health, and node pressure all matter, but only when they are connected to ownership and workload intent.
Polyaxon adds that ML context: runs, projects, queues, components, artifacts, and services. Use run monitoring for workload resource context, and correlate infrastructure telemetry with run identifiers in your monitoring stack. This connects a cluster symptom to the workload and owner who can act on it.