How to leverage Kubernetes metrics
Use Kubernetes resource, object-state, and control plane metrics to diagnose scheduling delays, size workloads, and design actionable alerts.
Kubernetes metrics become useful when they change a decision: whether to resize a training job, add node capacity, investigate a rollout, or fix a scheduling constraint. Three groups of signals help answer those questions: resource metrics, cluster state metrics, and control plane metrics.
Resource metrics track the availability of important resources like CPU, memory, and storage. Accessing these metrics is important for ensuring cluster health and the performance of the applications running on Kubernetes.
Cluster state metrics are important for knowing about the health and availability of Kubernetes objects including pods and deployments.
Control plane metrics are exposed by Kubernetes directly and provide metrics for each of the core components in the control plane, including the API server, controller managers, schedulers, and etcd.
This article uses those groups to work from an operational question to an action. For collection endpoints, metric names, and command syntax, see how to use Kubernetes metrics.
Kubernetes emits plenty of metrics. Most of them are noise until they answer a specific operational question: which pod is throttled, which node is saturated, which queue is blocked, or which workload changed after a rollout.
For ML platforms, metrics matter most when they connect infrastructure behavior to run context. CPU, memory, GPU, and storage signals are more useful when you can tie them back to the experiment, service, or pipeline that caused them. For a broader monitoring framework, see our Kubernetes monitoring guide.
Kubernetes resource metrics overview
Start by separating measured consumption from configured capacity. A container can use 200 millicores while requesting two CPU cores. The first number describes recent work; the second affects where the scheduler can place it. Neither number alone establishes whether the workload is sized well.
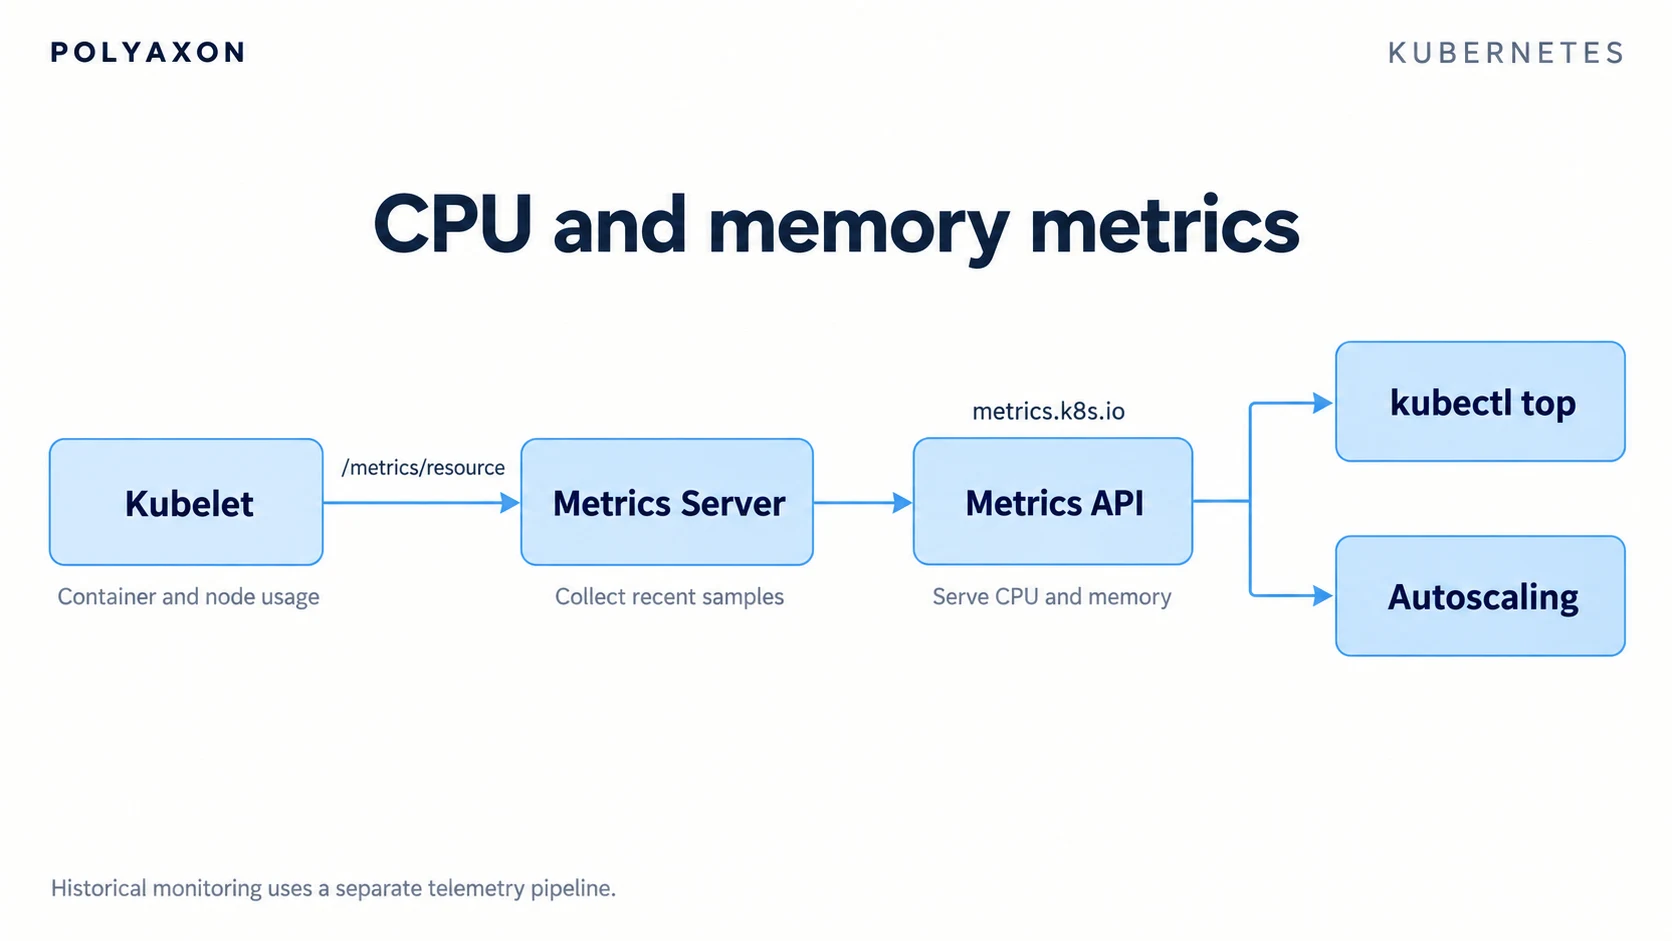
The resource Metrics API supplies recent CPU and memory measurements. It does not include GPU utilization, storage latency, queue delay, or application throughput. Add those signals from the relevant exporters and application instrumentation before drawing conclusions about the bottleneck.
For example, low GPU utilization can reflect input starvation, checkpoint writes, synchronization, or an application that is waiting on another service. Adding GPUs only helps if accelerator capacity is the limiting resource.
Metrics Server collects recent kubelet samples for kubectl top and autoscaling. A monitoring
backend retains the history needed to compare startup, steady work, evaluation, and checkpointing.
That history is collected separately from Metrics Server; see its intended use cases.
Use a representative workload window before changing requests or limits. A quiet minute after model loading can hide the memory peak that determines whether the next restart succeeds.
| Observation | Evidence to add | Decision it can support |
|---|---|---|
| Sustained CPU demand and growing request latency | Throttling, concurrency, request rate, and downstream timing | Adjust CPU policy or scale replicas if CPU is the bottleneck |
| Memory climbs during data loading | Batch size, workers, prefetching, and allocation profiles | Bound memory demand or size the workload for its peak |
| GPUs are idle during a training step | Input throughput, CPU use, storage latency, and step timing | Improve the input path before buying more accelerator capacity |
| Nodes look quiet but Pods remain pending | Requests, allocatable resources, placement constraints, and events | Resolve scheduling fit before changing utilization targets |
Tracking resource metrics and availability is important in ensuring that end users can access your applications. CPU utilization, available vs. used memory, and storage are finite resources, and metrics can be used to determine the load on the servers and whether additional resources must be added to the cluster. These metrics can also indicate when resources are overprovisioned and there could be an opportunity to reduce usage and costs.
Cluster state metrics overview
Object state tells you whether Kubernetes has achieved the intended workload layout. Read that state
with kubectl, or collect it through kube-state-metrics for trends and alerts. A replica can consume
little CPU because it is healthy and idle, or because it never became ready; usage cannot distinguish
those cases.
Node status is a popular cluster state metric. For example, in Kubernetes, node conditions might
include Ready, MemoryPressure, DiskPressure, and more. In kube-state-metrics, the following
metric
name returns the status of the node: kube_node_status_condition
For a Deployment, compare available and unavailable replicas with the desired count. Use
kube_deployment_status_replicas_available and kube_deployment_status_replicas_unavailable;
for a DaemonSet, inspect kube_daemonset_status_number_unavailable instead. These represent different
controller states. See the kube-state-metrics catalog
for their definitions and labels.
Interpret a node condition using both its condition and status labels. A true MemoryPressure
condition is a useful lead, but the next action still depends on node events and the workloads that
share its memory. Missing exporter samples are not evidence that all conditions are false.
Control plane metrics overview
As mentioned previously, Kubernetes provides metrics for the core control plane components, including the API server, controller managers, schedulers, and etcd. These control plane components are critical for ensuring cluster management, so tracking the availability and performance of these components is essential.
Here are a few control plane metrics that you should consider monitoring:
etcd_server_has_leader: investigate members that cannot see a leader alongside peer connectivity, storage latency, and request failures. One member's gauge is not a complete cluster-health verdict.apiserver_request_duration_seconds: compare request latency by operation and resource so a slow class of requests is not hidden by the cluster-wide average.scheduler_schedule_attempts_total: distinguishunschedulableresults from internalerrorresults. Attempt counts and their rates are separate from the duration histogramscheduler_scheduling_attempt_duration_seconds.
The Kubernetes metrics reference and etcd metrics documentation define these signals. Managed control planes may expose only a provider-selected subset. When that is the case, combine provider health information with Pod events instead of assuming an inaccessible metric is zero.
Accessing resource metrics with Kubectl
Kubectl is a powerful command-line tool that allows engineers to perform a large number of actions on a Kubernetes cluster, without needing to make API calls directly.
Use command-line observations to narrow a hypothesis, then compare them with retained history.
The following workflow assumes read access to the workload namespace and nodes, plus a working
Metrics API for top. Replace the example names with your resources.
Using Kubectl get
First locate the affected workloads and their nodes. Capture container resource policies alongside usage so you can compare what was requested with what was consumed:
kubectl get pods -n ml-workloads -o wide
kubectl get pod training-job -n ml-workloads -o yaml
kubectl get pods.metrics.k8s.io training-job -n ml-workloads -o json
The metrics response includes the measurement timestamp and CPU averaging window. A pending Pod may not have a container or metrics yet. Its YAML and events can still explain why it has not started.
Using Kubectl top
With a properly installed Metrics Server, you can use the kubectl top command to pull metrics for
pods, nodes, and even individual containers.
Compare the target namespace with its nodes:
kubectl top nodes
kubectl top pods --namespace ml-workloads --containers --sort-by=memory
Use these recent samples to select a container or node for deeper inspection. Do not reduce a memory limit or request solely because this snapshot is low; compare several equivalent runs and their peak demand first. The CPU throttling guide explains another reason CPU usage alone can be misleading.
Using Kubectl describe
If you're interested in knowing more about how resources are allocated within nodes, you can use the
kubectl describe node <NODE_Name> command to learn more.
describe node reports configured allocations, conditions, and events; it does not measure each
Pod's current consumption. Inspect the Pod as well, since its events often name the constraint:
kubectl describe node worker-1
kubectl describe pod training-job -n ml-workloads
Worked example: low utilization with a pending training job
Suppose an eligible node has 16 GiB of allocatable memory. Its running Pods request 14 GiB in total but currently consume only 5 GiB. A new training Pod requests 4 GiB, and its events report insufficient memory. These numbers are illustrative, not measurements from a benchmark.
The scheduler has only 2 GiB of uncommitted request capacity on that node. The low usage chart does not make the 4 GiB request fit. Check the other eligible nodes, taints, affinity, and volume topology before deciding there is no capacity anywhere in the cluster.
Three actions could be appropriate, depending on the evidence:
- Correct overestimated requests on existing workloads after reviewing representative peaks.
- Add suitable node capacity when the existing requests reflect real demand.
- Schedule the job after another workload finishes when the delay is acceptable.
Reducing the new job's request just to get it admitted can move the failure from scheduling to runtime memory pressure. Keep a note of the chosen change, workload version, and subsequent queue delay and memory behavior so the next decision has evidence.
Accessing the Kubernetes dashboard
Use dashboards to put the same decision evidence side by side: live usage, requests and limits, desired and available replicas, pending work, and recent changes. Keep the workload and time range consistent across panels. A chart for one node and events from another can suggest a false cause.
The original Kubernetes Dashboard is archived and unmaintained. For an existing web interface or a maintained alternative such as Headlamp, verify the data source and retention rather than assuming a default historical window. Long-term comparisons require a monitoring backend.
Turn the investigation into an actionable alert
Choose an alert condition that reflects an operational consequence. Sustained unavailability or a queue delay beyond the team's target is more useful than notifying on every brief CPU spike. Define the duration, owner, affected workload, and first diagnostic step together.
For the scheduling example, an alert could identify a training queue whose oldest waiting item has exceeded its agreed start-time target, then link to Pod scheduling events and node request capacity. The threshold belongs to that queue's service expectation; it is not a universal Kubernetes default. Distinguish work still waiting in the platform queue from a submitted Kubernetes Pod that cannot be scheduled.
Conclusion
Kubernetes metrics play an important role in ensuring cluster health and application performance. In this article, we introduced the three fundamental types of Kubernetes metrics: resource metrics, cluster-level metrics, and control plane metrics. Depending on your use cases, and the applications running on Kubernetes, you may want to prioritize certain metrics in your monitoring and alerting. Resource metrics in particular are important because they showcase the availability of core resources, like CPU and memory, which are needed to run your workloads.
Identifying the metrics that matter is an important first step. And once you've identified the metrics that most matter in your environment, it's strategically important to put in place a toolset that allows your team to monitor, track, and alert on changes in these metrics.
For ML platforms, Polyaxon provides run, project, queue, component, and artifact context. Compare run monitoring with the relevant infrastructure window, then capture the resulting policy in scheduling presets. The useful outcome is a justified change and a way to observe whether it improved the workload.