Kubernetes CPU limits and throttling overview
Understand Kubernetes CPU requests, limits, throttling, and the failure modes caused by weak resource configuration.
CPU requests and limits are not decoration in a manifest. Requests influence scheduling. Limits influence throttling. Bad values can make a service slow, a job unpredictable, or a shared cluster unfair.
For ML workloads, CPU problems often hide behind GPU complaints. A GPU can sit idle because the input pipeline is CPU-throttled. Before buying more accelerators, inspect the boring resource controls.
What are CPU limits and requests?
Kubernetes combines several controls to manage shared capacity: resource requests and limits, namespace quotas, default resource policies, and workload priority. They solve different problems. For example, priority can influence scheduling and eviction decisions, but it does not prevent an OOM kill when a container exhausts its memory allowance.
Requests and limits describe how Kubernetes should place a workload and constrain its resource use.
Requests are used for scheduling. The scheduler checks whether a Pod's requests fit within a node's allocatable capacity after accounting for already scheduled workloads. A CPU request also influences the container's relative share of CPU time under contention. A request alone does not pin a dedicated core or force the application to consume that amount. A container can use more than its request when capacity and its effective limits allow it.
Limits constrain runtime use. On Linux, CPU limits normally impose a CPU-time budget, while
memory limits are enforced through memory accounting, reclaim, and potentially OOM killing. These
are different enforcement mechanisms, even though both are configured under resources.limits.
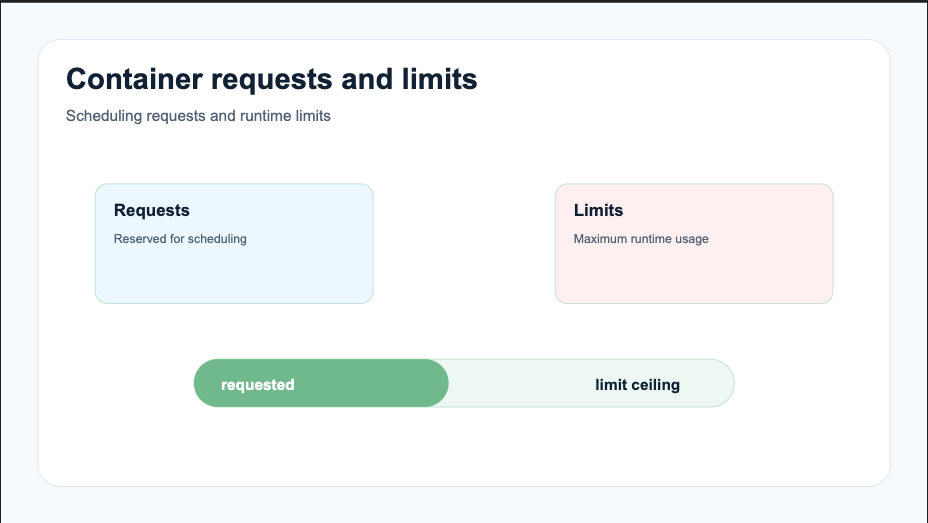
The diagram summarizes the configuration relationship. A request is not preallocated application usage, and memory-limit enforcement is reactive rather than a smooth cap on a usage graph.
For each resource, the request must be less than or equal to its limit when a limit is specified. Equality is valid. If you specify a limit without a request and no admission policy supplies a request, Kubernetes uses the limit as the request. See the resource-management documentation for scheduling and enforcement details.
CPU is measured in CPU units: 1 is one CPU, 1000m is also one CPU, and 250m is one quarter of a
CPU. Memory uses byte quantities, commonly Mi and Gi. The m suffix means milli, so it should not
be used when you mean mebibytes of memory.
CPU throttling and OOM Killed
Many teams run business-critical workloads in a shared Kubernetes environment. Limits can provide resource boundaries between tenants, but configured limits and measured usage are different inputs to capacity planning or chargeback.
With normal Linux CPU quota enforcement, throttling occurs when a container uses its CPU-time budget for an enforcement period. Its runnable tasks must wait for budget to become available again. The kernel restricts execution time; it does not reduce the physical CPU's clock speed.
For example, an 80m limit with an illustrative 100 ms enforcement period corresponds to 8 ms of CPU
time per period. Parallel threads can spend that budget quickly, leaving the application waiting
even when the node has spare CPU capacity. Short bursts can also cause throttling while a longer
usage average looks lower than the limit. The
Linux CPU bandwidth documentation
explains quota and period behavior.
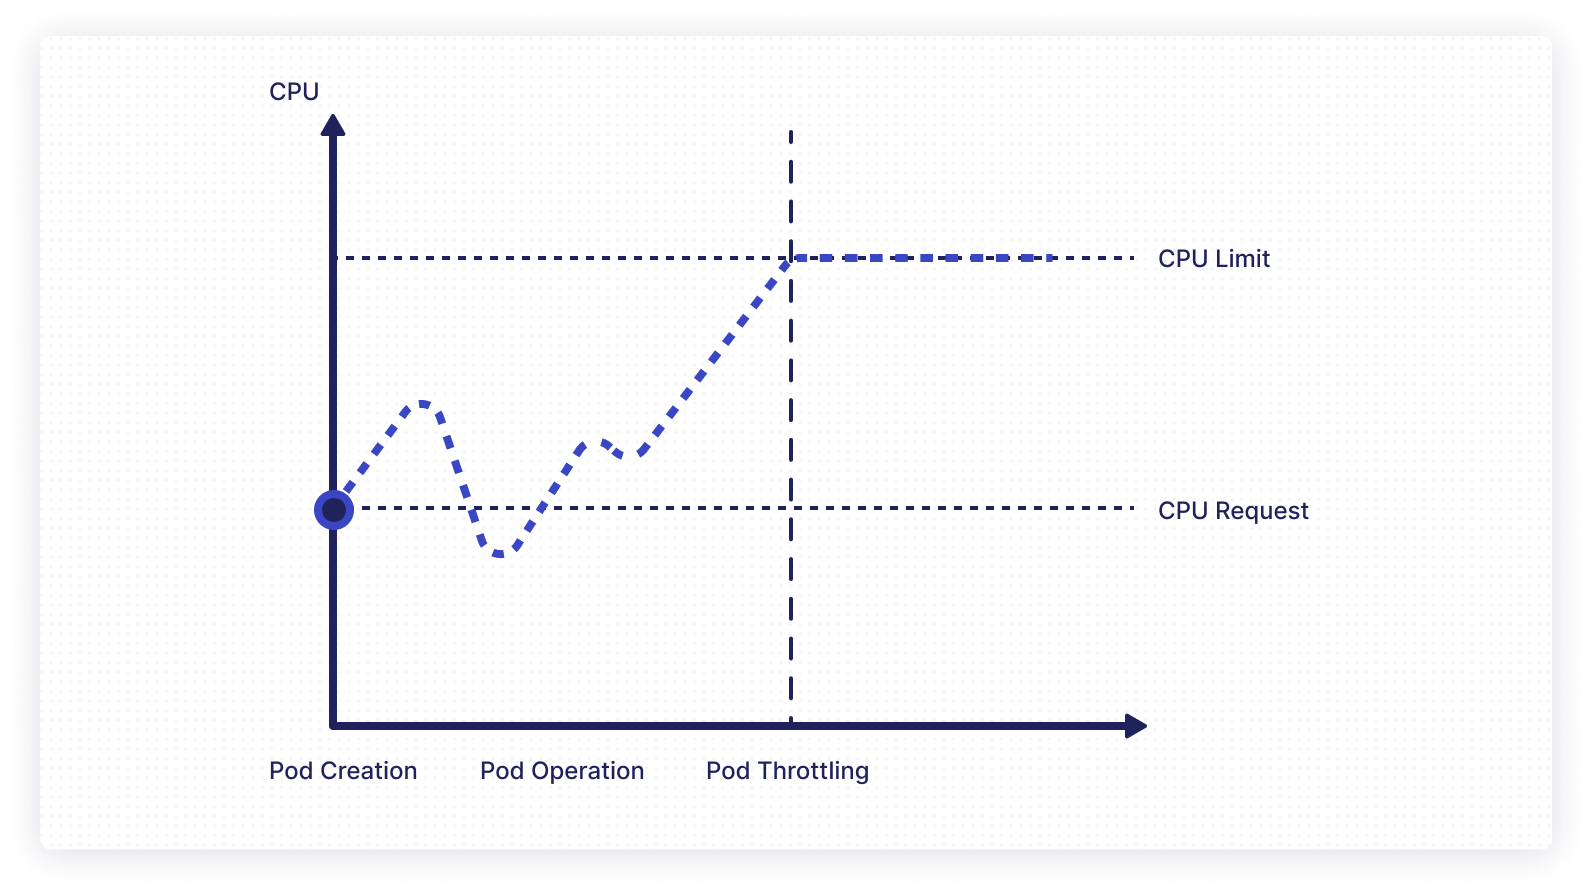
This is a conceptual illustration, not a measured trace. CPU use may fall below the request, and throttling can occur intermittently rather than producing a permanently flat line at the limit.
The fractional CPU examples below use shared CPUs. CPU Manager can assign exclusive CPUs to eligible workloads, with different quota behavior depending on node configuration. Consult the resource-manager documentation when operating dedicated CPU allocations.
OOM killing is a memory event. If memory reclaim cannot satisfy an allocation within a
container's memory cgroup limit, the kernel can terminate a process. This can happen while the host
still has free memory, because the container has exhausted its own allowance. If the container's
main process is killed, Kubernetes can report OOMKilled and restart it according to its restart
policy.
Node-wide memory pressure can also trigger kubelet eviction or kernel OOM killing. Those outcomes are different from CPU throttling; a CPU-saturated node does not inherently shut down. Repeated memory failures can still disrupt neighboring workloads and recovery, so inspect both container and node evidence. Our OOMKilled troubleshooting guide walks through that diagnosis.
The risks of operating Kubernetes without limits
Missing or poorly chosen resource controls can create several risks:
- OOM errors and eviction: Without a memory limit, a growing container can contribute to node-wide memory pressure. The kubelet may evict Pods, or the kernel may kill processes. A memory limit contains some of that risk, but a limit that is too small can cause container-level OOM kills.
- Excessive CPU use: A container without a CPU limit can use available CPU within the node's other constraints. Under contention, requests influence sharing. Incorrectly small requests can let the scheduler pack too many CPU-hungry workloads together, increasing latency.
- Increased expenses: Over-requesting can reserve scheduling capacity that the workload rarely uses. Under-requesting can lead to poor packing decisions, slow jobs, retries, and reactive overprovisioning. The cost depends on workload behavior and the cluster's scaling policy.
- Resource hogging: Unbounded work can consume shared CPU, memory, or other resources and affect neighboring services. Use appropriate requests, resource-specific limits, namespace policy, and monitoring together instead of expecting one limit to provide complete isolation.
Omitting a CPU limit can be a deliberate way to let trusted workloads use spare capacity when the platform's policy allows it. That decision still requires realistic requests and monitoring. Memory has different failure behavior and should be evaluated separately. Kubernetes describes node-pressure eviction separately from container resource-limit enforcement.
Side effects of setting wrong resource limits
Resource limits also have tradeoffs. A CPU limit below the application's burst needs can increase latency or extend a training job through throttling. A CPU request that is too small can reduce its share when neighboring workloads compete. These are distinct effects, and context switching alone does not explain either one.
An unnecessarily high request can leave Pods pending or reduce how many workloads fit on a node, even when actual use is low. A high limit alone does not reserve that capacity, although a limit copied into an omitted request can affect placement. A memory limit that is too low can cause OOM kills; one that is too high may provide little protection from node pressure.
Measure startup, data loading, steady-state work, and checkpointing separately before choosing values. Our resource right-sizing guide connects these phases to ML workload performance and capacity planning.
How resource requests and limits work
Container resources are declared under spec.containers[].resources in a Pod, or under the Pod
template in a workload controller. This standalone example sets both CPU and memory resources:
apiVersion: v1
kind: Pod
metadata:
  name: cpu-memorylimit-demo
spec:
  containers:
    - name: cpu-memorylimit-demo-container
      image: nginx:1.30.4-alpine
      resources:
        requests:
          memory: "64Mi"
          cpu: "250m"
        limits:
          memory: "128Mi"
          cpu: "1"
The scheduler accounts for a request of 64Mi of memory and 250m of CPU. The application can use
more than those requests, subject to available capacity and its limits of 128Mi and one CPU.
The memory request is not an immediately allocated private block of RAM.
This snippet illustrates the resource fields independently. The narrower CPU policy in the next
section would reject its 250m request and 1 CPU limit; use the separate Pod manifest provided
there for the LimitRange exercise.
How to set resource limits in Kubernetes
Kubernetes provides LimitRange to set resource defaults and validate resource specifications
within a namespace. A LimitRange can constrain individual containers or Pods; it does not configure
node capacity or continuously meter the namespace's usage.
With LimitRange, you can require resource values to fall within a permitted range. Admission adds configured defaults and rejects specifications outside the policy. The resulting container limits are then enforced at runtime. Changing a LimitRange does not rewrite resources on existing Pods.
A LimitRange can define:
- Minimum and maximum resource requests and limits.
- A maximum limit-to-request ratio through
maxLimitRequestRatio. - Default requests through
defaultRequestand default limits throughdefault.
Use ResourceQuota when you need aggregate namespace constraints as well. Without configured defaults or other policies, a container may have no explicit CPU or memory limit, but it still runs within the node's available resources. The LimitRange documentation explains the admission rules.
In the following sections, you'll set a small CPU range in a dedicated development namespace and create a Pod whose resource specification satisfies it. This demonstrates admission and effective configuration; an idle NGINX container does not by itself demonstrate CPU throttling.
Prerequisites
To follow along with this tutorial, you'll need the following:
- A development Kubernetes cluster with a Linux worker node, such as a local Minikube cluster.
kubectlconfigured for that cluster, with permission to create a namespace, LimitRange, and Pods.- For usage readings, Metrics Server or another provider of the resource metrics API. Prometheus with suitable container metrics is needed for the optional throttling query below.
The following steps will be performed in the cluster:
- Create a dedicated namespace and configure a CPU LimitRange.
- Deploy a Pod with an allowed CPU request and limit, then inspect its effective resources.
- Compare valid and invalid values, observe available metrics, and remove the example resources.
Set up a LimitRange in a dedicated namespace
Check your current context and create the example namespace:
kubectl config current-context
kubectl create namespace cpu-limits-demo
Save the following as set-limit-range.yaml:
apiVersion: v1
kind: LimitRange
metadata:
  name: set-limit-range
  namespace: cpu-limits-demo
spec:
  limits:
    - max:
        cpu: "100m"
      min:
        cpu: "50m"
      defaultRequest:
        cpu: "50m"
      default:
        cpu: "100m"
      type: Container
Run the following command to create a LimitRange in the cluster:
kubectl apply -f set-limit-range.yamlTo inspect the configured minimum, maximum, and defaults, run:
kubectl --namespace cpu-limits-demo describe limitrange set-limit-rangeExpect a container CPU minimum of 50m, maximum of 100m, default request of 50m, and default
limit of 100m. A new container that omits both CPU fields receives those defaults. The bounds are
inclusive, and this policy does not define memory bounds or defaults.
Deploy a Pod within the LimitRange
In this section, you'll create a Pod with a 60m CPU request and an 80m CPU limit. These values
describe its configuration, not how much CPU NGINX must consume.
Create a file called pod-with-cpu-within-range.yaml, and paste in the following contents:
apiVersion: v1
kind: Pod
metadata:
  name: pod-with-cpu-within-range
  namespace: cpu-limits-demo
spec:
  containers:
    - name: pod-with-cpu-within-range
      image: nginx:1.30.4-alpine
      resources:
        limits:
          cpu: "80m"
        requests:
          cpu: "60m"
Create the Pod and wait for readiness:
kubectl apply -f pod-with-cpu-within-range.yaml
kubectl --namespace cpu-limits-demo wait --for=condition=Ready \
  pod/pod-with-cpu-within-range --timeout=180s
The specification satisfies the LimitRange. Scheduling capacity, image access, and other admission policies still affect whether the Pod starts. Inspect the actual resource fields and any events:
kubectl --namespace cpu-limits-demo get pod pod-with-cpu-within-range -o yaml
kubectl --namespace cpu-limits-demo describe pod pod-with-cpu-within-range
With this LimitRange, the following CPU combinations have these admission outcomes, assuming no additional policy rejects them:
| Request | Limit | Outcome |
|---|---|---|
50m | 80m | Accepted: the minimum is inclusive. |
60m | 80m | Accepted: the tutorial's configuration. |
100m | 100m | Accepted: request and limit may be equal, including at the maximum. |
40m | 80m | Rejected: the request is below the 50m minimum. |
60m | 120m | Rejected: the limit exceeds the 100m maximum. |
90m | 80m | Rejected: the request exceeds the limit. |
A 40m request is rejected before the Pod runs. It is not a container that starts successfully and
then gets throttled for requesting too little. The
CPU constraints tutorial
shows these admission checks in more detail.
Observe usage and throttling
If your cluster has a working resource metrics API, inspect recent usage with:
kubectl --namespace cpu-limits-demo top pod pod-with-cpu-within-range --containerskubectl top reports sampled CPU and memory use. It does not report CPU throttling or capture every
short-lived peak. A newly started Pod may need time before metrics appear.
If you use Minikube's Dashboard, you can also open it with the dashboard command:
minikube dashboardSelect the cpu-limits-demo namespace and inspect the Pod. Usage charts depend on the metrics
integration; the resource fields in the Pod specification describe requests and limits.
For historical throttling evidence, inspect your Linux cgroup or Prometheus/cAdvisor metrics. When your Prometheus setup exposes the relevant cAdvisor counters and Kubernetes labels, the following query calculates the fraction of CPU enforcement periods that included throttling:
sum by (pod, container) (
  rate(container_cpu_cfs_throttled_periods_total{
    namespace="cpu-limits-demo",
    pod="pod-with-cpu-within-range",
    container="pod-with-cpu-within-range"
  }[5m])
)
/
sum by (pod, container) (
  rate(container_cpu_cfs_periods_total{
    namespace="cpu-limits-demo",
    pod="pod-with-cpu-within-range",
    container="pod-with-cpu-within-range"
  }[5m])
)
A value of 0.2 means throttling occurred in 20% of the measured enforcement periods; it does not
mean 20% of CPU time or application throughput was lost. Interpret the ratio only with a nonzero
denominator and sufficient samples. Missing metrics do not prove that no throttling occurred.
The cAdvisor metric reference
describes these counters and their availability options.
Correlate throttling with CPU use, request latency, training throughput, and data-loader activity. An idle NGINX Pod may show no throttling. For collection and label setup, see our Kubernetes monitoring guide.
Add a valid memory request and limit
Memory settings belong to the container as well. This replacement resource fragment keeps CPU
within the namespace's allowed range and adds a 64Mi memory request with a 128Mi limit:
resources:
  limits:
    cpu: "80m"
    memory: "128Mi"
  requests:
    cpu: "60m"
    memory: "64Mi"
Place the fragment under the container when creating a new Pod. If you already created this disposable example, update its saved manifest and delete and recreate that Pod to apply the revised settings. For a controller-managed workload, update its Pod template and follow its rollout process; in-place resource resizing depends on cluster support and uses a separate mechanism.
The namespace's CPU LimitRange still applies. These memory values configure one container; they do
not establish a namespace memory policy or force usage to remain at one observed value. A 40Mi
memory request with a 20Mi limit would be rejected because the request exceeds the limit.
Clean up the example
Delete the example Pod and LimitRange using their manifests:
kubectl delete -f pod-with-cpu-within-range.yaml
kubectl delete -f set-limit-range.yaml
If the namespace contains only this tutorial's resources, remove it:
kubectl delete namespace cpu-limits-demoFinal thoughts
CPU requests and limits shape how Kubernetes schedules and throttles workloads. Bad values create noisy neighbors, slow services, and confusing performance regressions.
For ML workloads, resource policy should be explicit. Polyaxon scheduling presets let teams reuse resource configurations, while queues in Polyaxon Cloud and EE organize routing, priority, concurrency, and resource quotas. Kubernetes remains responsible for admitting and enforcing the resulting Pod resources. Measure representative workloads and promote the values that support useful progress, so every run does not become a fresh resource negotiation.