Optimize LLM inference with repeatable benchmarks
Compare inference optimizations against a fixed workload, latency limits, and quality checks, with benchmark configurations and results tracked in Polyaxon.
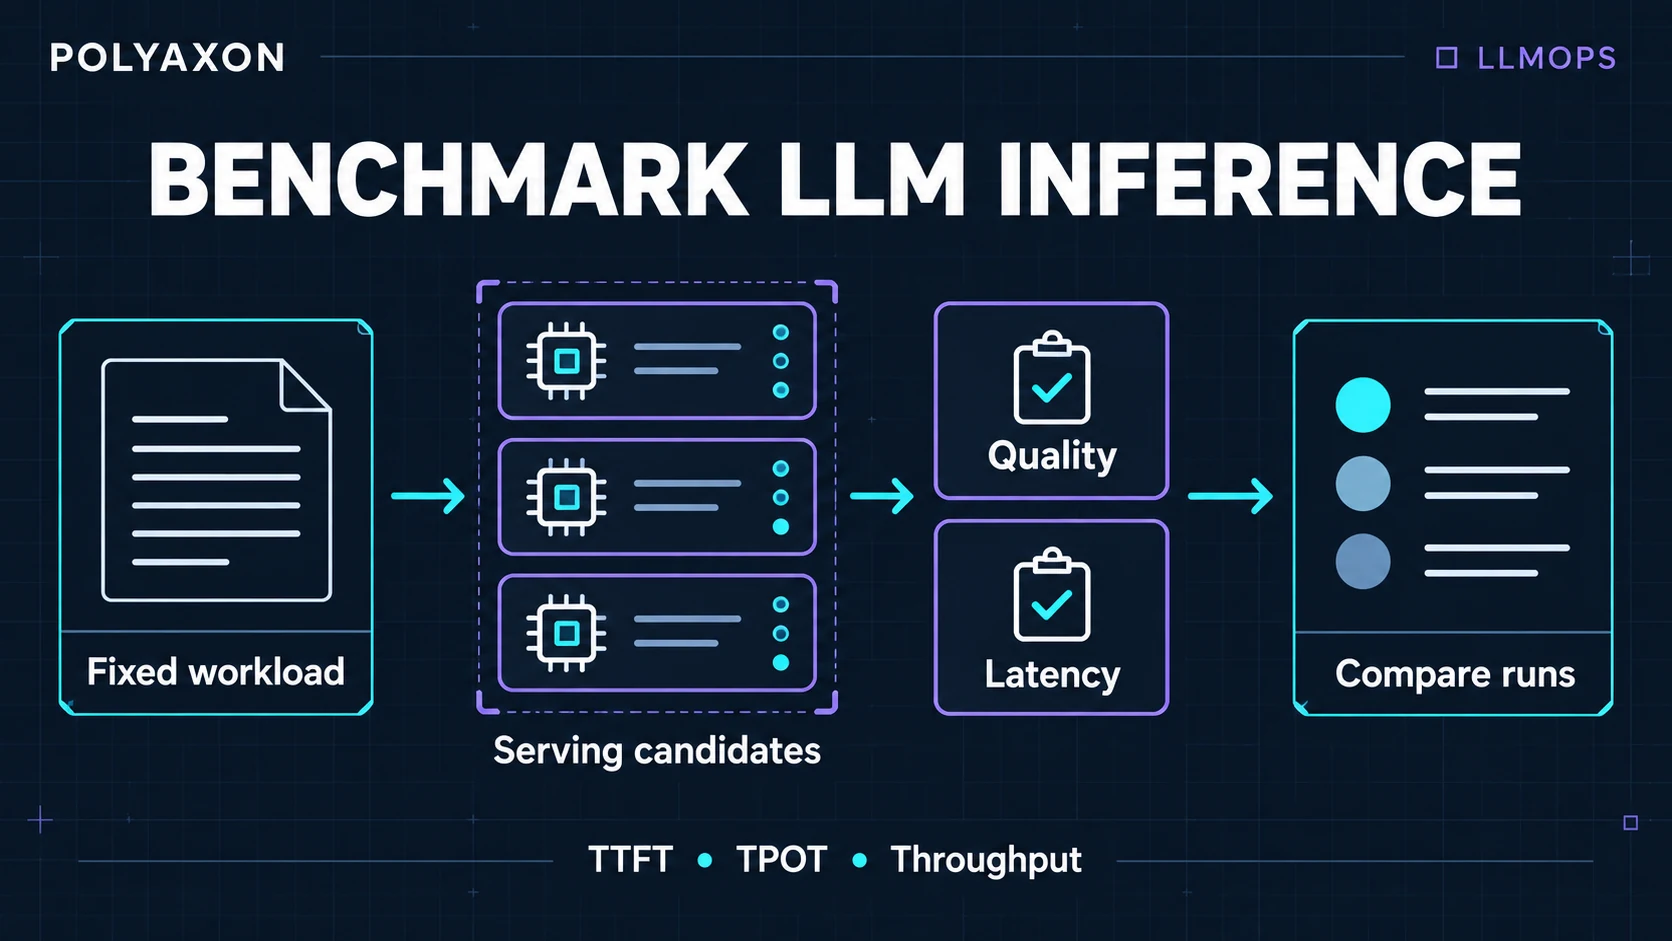
Your LLM server processes more tokens per second after a configuration change, but users wait longer for the first word. Another change reduces memory use, yet the model starts missing details in long documents. Both can look like improvements if the benchmark records only the number you hoped to improve.
A useful inference benchmark answers a narrower question: which serving configuration handles your workload while meeting its quality and response-time requirements?
This guide builds that comparison around a streaming support assistant. The same method works for batch generation with different acceptance criteria. The serving engine performs the optimization; Polyaxon keeps the workload, configuration, measurements, and decision together. For token pricing, routing, and application-wide accounting, use the companion guide to LLM performance and cost experiments.
Define the workload before choosing an optimization
The assistant answers short questions, reads retrieved documents, and sometimes produces long explanations. Preserve those differences in a versioned dataset. Record each prompt's token count, expected task outcome, and workload group. Keep rare but important cases, such as an exception buried near the end of a document.
Freeze the model and tokenizer revisions, chat template, sampling settings, output limit, serving image, hardware allocation, and benchmark-client version. Treat a changed model, prompt, or truncation policy as a separate experiment. Otherwise, faster inference might simply mean generating less useful work.
Define acceptable answer quality, request failure rate, and latency limits before inspecting results. For this assistant, an answer must cite the supplied evidence and preserve relevant exceptions. Review those requirements on the same cases for every candidate.
Choose a load model deliberately. Fixed concurrency replaces a completed request with another; an arrival-rate workload sends requests according to a specified schedule. They answer different questions. Record offered load, achieved completions, and timeouts, with a bounded maximum number of outstanding requests. NVIDIA's benchmark guidance explains how sequence lengths and load settings shape inference measurements.
Separate waiting, generation, and total throughput
Use the following definitions consistently across candidates:
| Measurement | What it tells you |
|---|---|
| Time to first token, or TTFT | Time from sending a request to receiving its first nonempty output token; includes client-visible queue and network delays. |
| Time per output token, or TPOT | For a response with multiple tokens, (last_token_time - first_token_time) / (output_tokens - 1). |
| End-to-end latency | Time from sending the request to receiving its complete response. |
| Output throughput | Completed output tokens divided by the declared measurement interval across the whole workload. |
| Request success and task acceptance | Whether requests completed and their answers met the rubric. These are separate checks. |
Report latency distributions, including tail percentiles, by workload group. Preserve the sample count and percentile method. A percentile of per-request TPOT averages does not describe every pause inside a streamed response; retain token or chunk arrival intervals when smooth streaming matters. A chunk can contain several tokens, so name the observed unit accurately.
Benchmark tools differ in their timing conventions. NVIDIA's metric definitions are a useful reference; record how your client treats empty chunks, single-token responses, failures, warmup, and the final completion event.
Match an optimization to the observed bottleneck
Autoregressive inference first processes the prompt, then generates additional tokens. A key-value cache retains attention state from earlier tokens so generation can reuse it. Longer active sequences increase cache storage requirements. Hugging Face's cache explanation describes this mechanism.
That distinction makes the candidate list more useful:
| Evidence from the baseline | Candidate to investigate | Comparison to preserve |
|---|---|---|
| Repeated long prefixes dominate input processing | Prefix caching | Cold requests, realistic prefix reuse, and unchanged answer quality |
| Generation stalls as long prompts arrive | Prefill scheduling and token-batch budgets | TTFT and generation latency together, under the same mixed traffic |
| Active sequences exhaust cache capacity | KV-cache memory management or lower concurrency | Preemptions, failures, tail latency, and total completions |
| Model weights consume too much device memory | A supported quantized configuration | Memory use, actual latency, and task quality |
| Generation dominates latency at the target load | Supported speculative decoding | Draft overhead, acceptance behavior, and end-to-end latency |
Prefix caching reuses matching input computation; it does not eliminate the work of producing new output tokens. A warm repeated-prompt demonstration cannot establish its value for mostly unique requests. See the vLLM prefix-caching documentation.
Batching and scheduling affect several requests at once. In vLLM, chunked prefill divides input processing into smaller pieces that can be scheduled with generation work. Its token budget changes the balance between TTFT, generation latency, and throughput. Cache pressure can also trigger preemption and recomputation. Use the vLLM tuning guide for your installed version rather than treating one batch setting as universally optimal.
Quantization reduces representation precision and memory requirements, but supported kernels depend on the hardware and format. Measure task quality and serving performance after the change; file size alone establishes neither. Check the vLLM quantization compatibility documentation.
Speculative decoding proposes tokens using a cheaper path and verifies them with the target model. The original algorithm preserves the target distribution through its verification procedure. Actual acceleration depends on the implementation and workload; vLLM explicitly recommends workload-specific measurement.
Some mechanisms are already part of the serving stack. FlashAttention reduces attention memory traffic through tiled computation; PagedAttention addresses KV-cache allocation and sharing. They solve different problems. Record the active backend before attributing an improvement to a feature name. The FlashAttention paper and PagedAttention paper explain their respective designs.
Run a controlled comparison
Start with a baseline and one candidate. For the support assistant, that might be two supported token-batch budgets with the model, hardware, dataset, and cache policy held fixed. First measure at modest load, then repeat near the service's intended operating load.
Separate initialization from steady-state measurement. Record model loading and compilation if startup matters; define warmup explicitly for the steady-state comparison. Run cold-cache and representative warm-cache scenarios separately. Do not let one candidate inherit another candidate's warmed prefixes unnoticed.
Repeat measurement windows and alternate candidate order when conditions can drift. Keep other experiments off a shared endpoint during each window. Confirm that the load generator is sustaining the requested traffic rather than becoming the bottleneck itself.
Review the response set as well as its timings. Timeouts, empty responses, truncation, and malformed outputs stay in the report. Evaluate quality by workload group so gains on short questions cannot hide a regression on document-heavy requests.
Keep the evidence in Polyaxon
Use one Polyaxon run per candidate, load setting, cache scenario, and repetition. Package the benchmark client as a component so every run uses the same procedure. A small grid search can enumerate those inputs. Set matrix concurrency: 1 when runs share an endpoint; this limits benchmark operations, while the benchmark client controls request concurrency inside each operation.
Have the benchmark produce three files: manifest.json for configuration and workload identity, summary.json for normalized numeric metrics, and requests.jsonl for request-level timings, outcomes, and quality decisions. These are your benchmark's files, not a built-in Polyaxon report format.
The following recorder runs inside a Polyaxon job with the polyaxon package installed, after those files exist. It preserves the evidence and makes selected summary fields comparable:
import json
import math
import shutil
from pathlib import Path

from polyaxon import tracking

manifest = json.loads(Path("manifest.json").read_text(encoding="utf-8"))
summary = json.loads(Path("summary.json").read_text(encoding="utf-8"))
metric_names = (
    "ttft_p95_ms",
    "tpot_p95_ms",
    "output_tokens_per_s",
    "request_success_rate",
    "task_pass_rate",
)
metrics = {name: summary[name] for name in metric_names}
for name, value in metrics.items():
    if type(value) not in (int, float) or not math.isfinite(value):
        raise ValueError(f"Missing or nonnumeric benchmark metric: {name}")

tracking.init()
tracking.log_inputs(
    candidate_id=manifest["candidate_id"],
    workload_revision=manifest["workload_revision"],
    cache_state=manifest["cache_state"],
    load_mode=manifest["load_mode"],
    load_value=manifest["load_value"],
    repeat_id=manifest["repeat_id"],
)
tracking.log_metrics(**metrics)
for filename in ("manifest.json", "summary.json", "requests.jsonl"):
    destination = Path(tracking.get_outputs_path(filename))
    shutil.copyfile(filename, destination)
    tracking.log_file_ref(path=str(destination), name=destination.stem)
The example expects rates as fractions from zero to one and latency values in milliseconds. Compute them from the declared measurement contract, including failed requests in the appropriate denominators. Keep unavailable metrics explicit in the report; do not replace missing evidence with zero.
Polyaxon's tracking API records the inputs, metrics, and file references. In the run comparison view, show the candidate and workload columns beside quality, latency, and throughput. Retain enabled resource measurements from the serving workload as well as the client; client CPU usage does not explain server GPU behavior.
Select within the requirements
Exclude candidates that fail the predefined quality, reliability, or latency requirements before ranking throughput. Among the remaining configurations, compare resource allocation and operating cost using the same accounting boundary.
Keep the baseline when an apparent gain is smaller than the variation between repeated windows. Save the chosen run IDs, acceptance criteria, workload revision, and reason for the decision. The next model, engine, or hardware update can then be evaluated against that same evidence instead of starting from another isolated tokens-per-second claim.